Why Is North America’s Equity Market Underperforming?
August 23, 2017On a relative basis, compared to the developed world, North American stocks peaked on November 23, 2016, and have since underperformed by about 4% (in USD). In the charts below, we compare the relative performance of our KLSU North America Index to various economic variables. Our KLSU North America Index captures the top 85% of the market cap in North America, is a market cap weighted index and USD based. Our KLSU DM Index captures the top 85% of the market cap of all 22 developed countries. It also is a market cap weighted index and USD based.
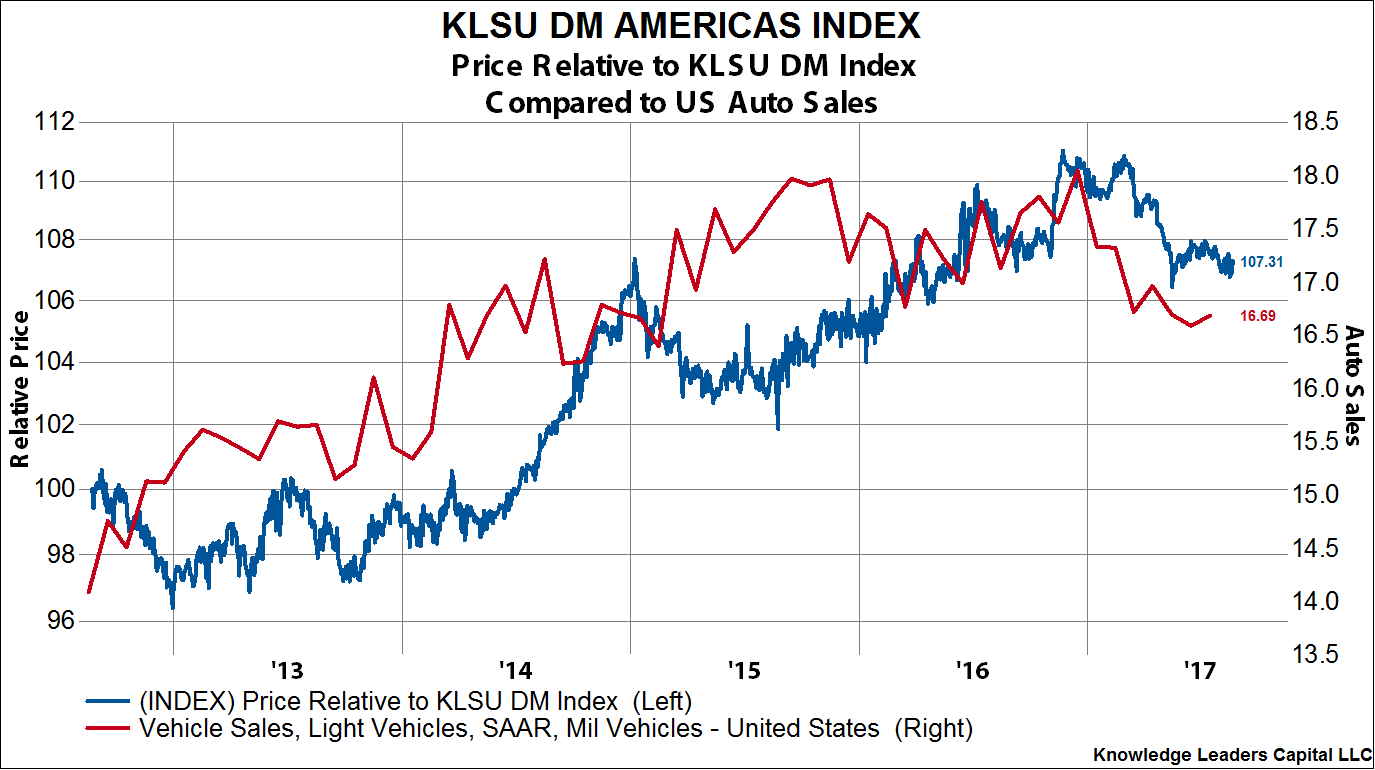
1. Auto sales have rolled over recently, having peaked at 18.05 million units in December 2016. The current run rate is 16.69 million units.
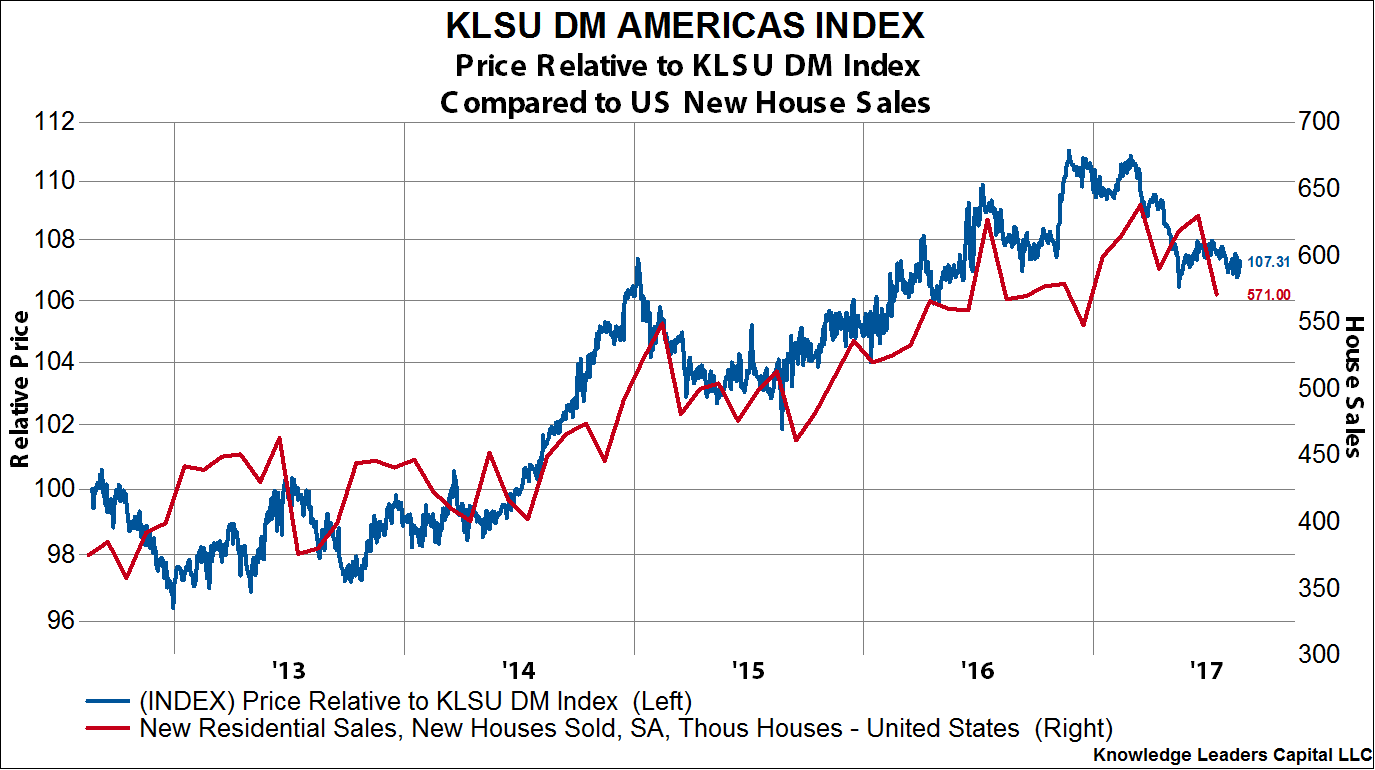
2. New house sales have stalled out. New house sales peaked in March at 638,000 units. July figures were released today showing sales have fallen to a level of 571,000 units.
3. Core inflation has slipped significantly lately, dropping from an annualized rate of 2.26% in January to a current level of 1.7%.
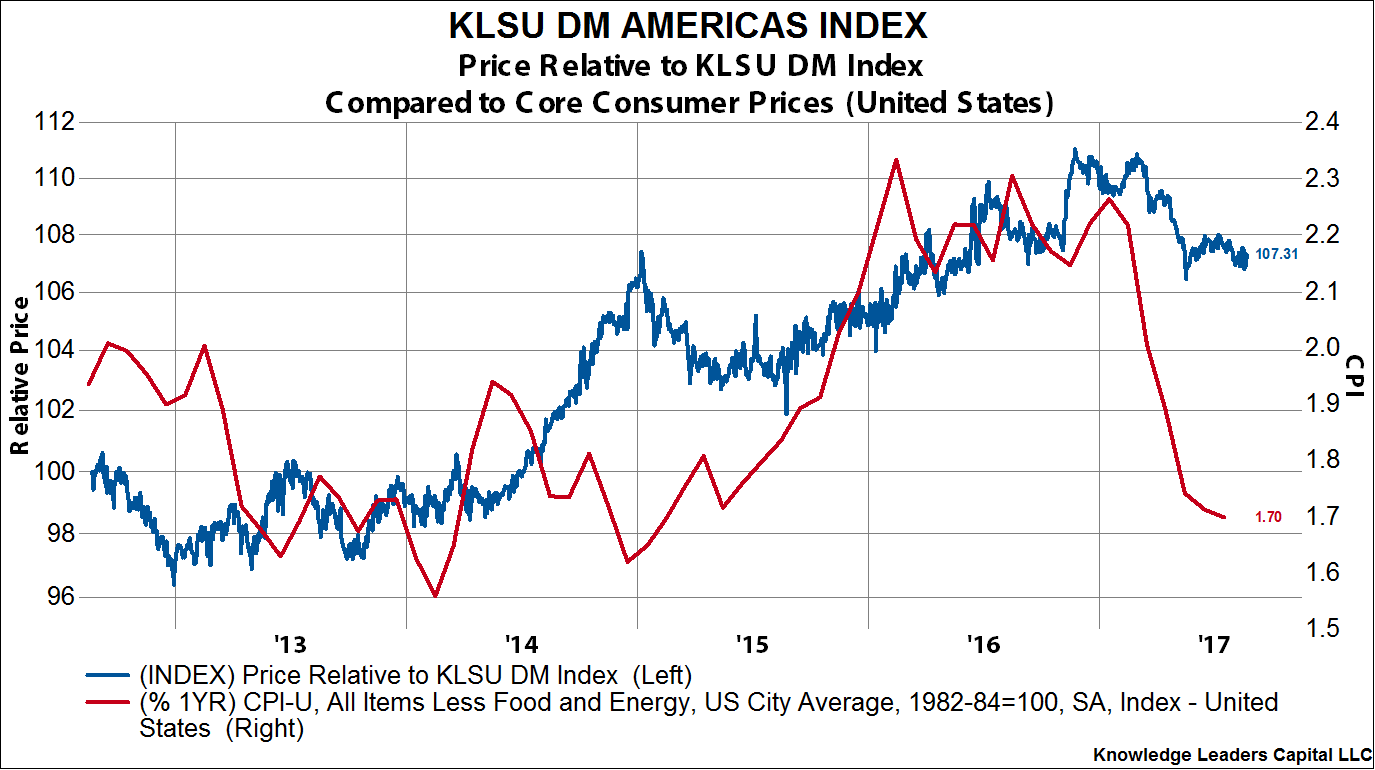
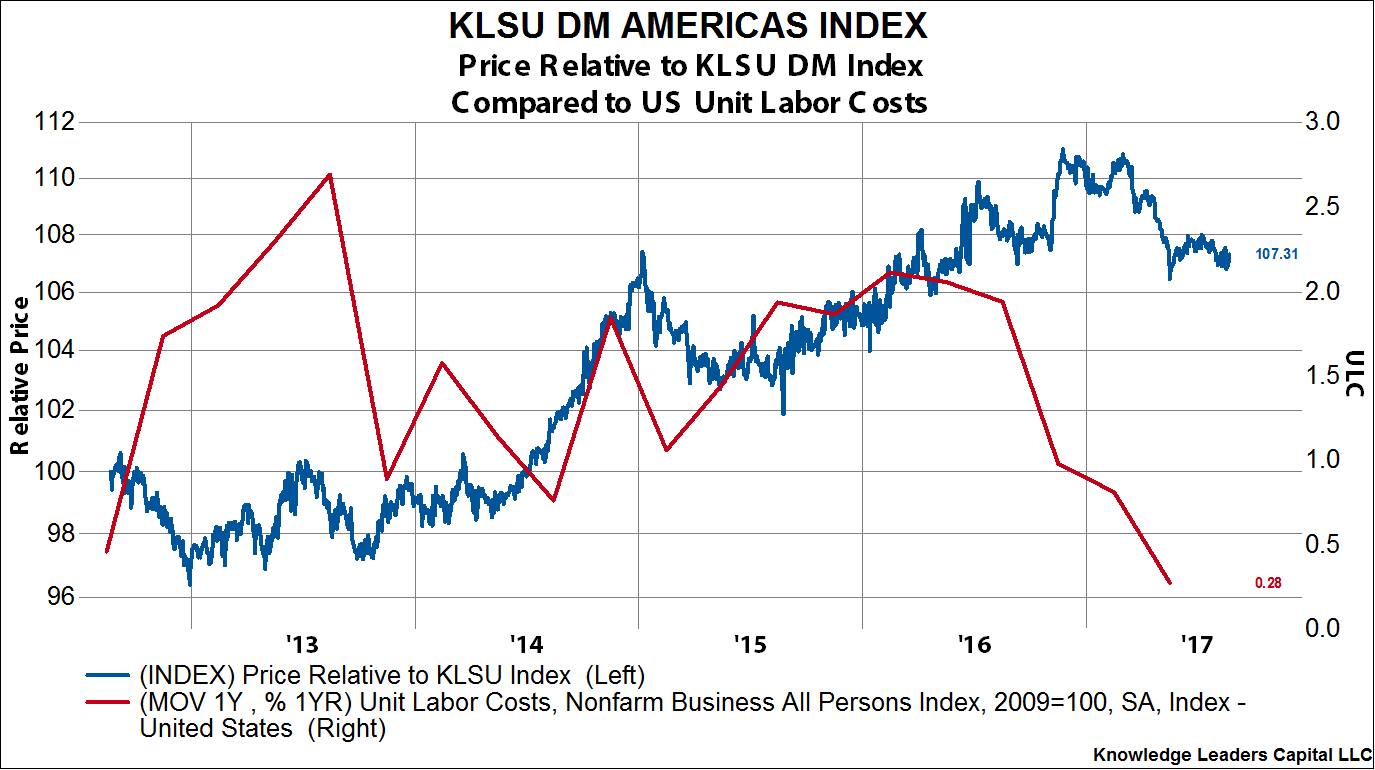
4. Driving the drop in inflation is the recent lower revision to compensation, which in turn caused a big revision down in corporate unit labor costs.
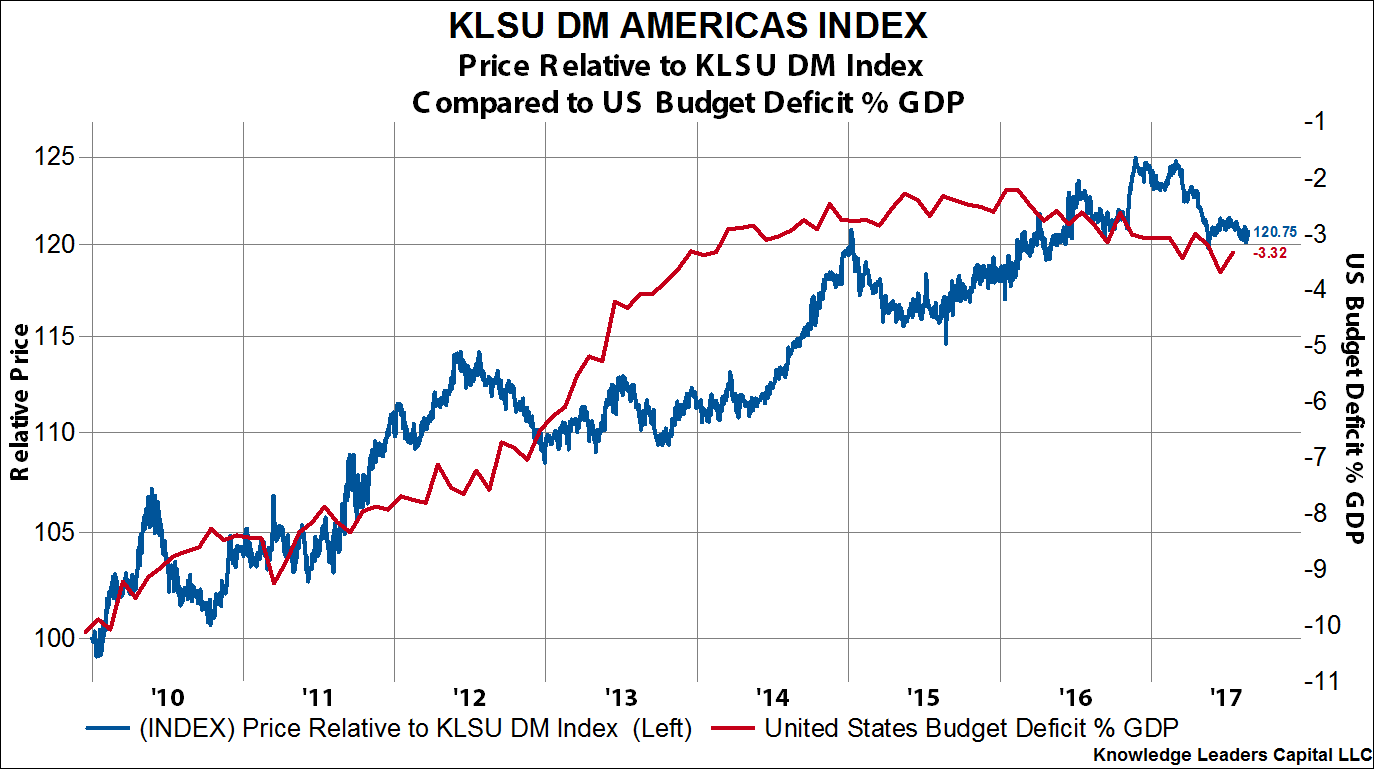
5. The US budget deficit is rolling over and beginning to widen again. After peaking at 2.21% of GDP in February 2016, the annualized budget deficit is now over 1% wider at 3.32% of GDP.
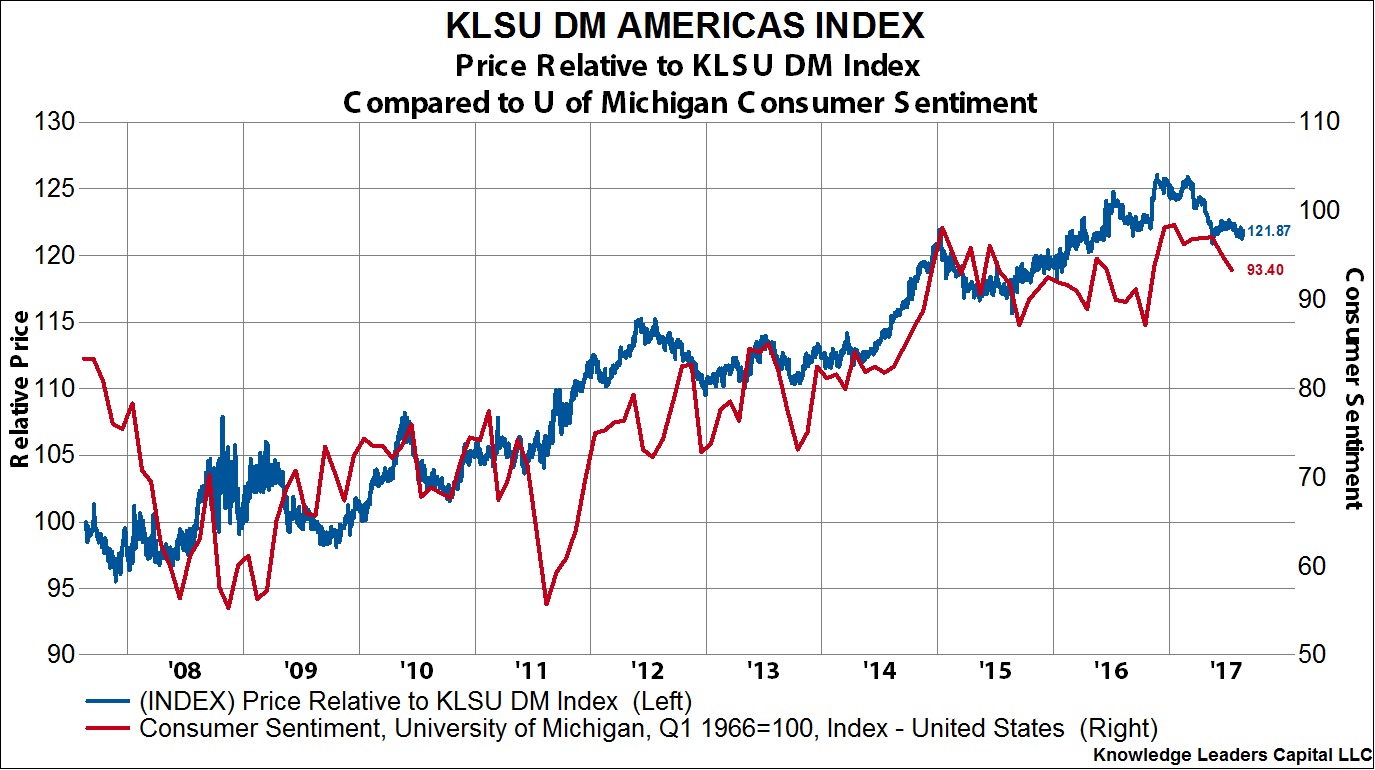
6. Lastly, it appears consumer confidence is waning, helping explain the weak retail figures we’ve seen.