

Energy Sector Performance in Context
October 30, 2018Energy is the best performing sector in four of six market-regions. (From two market groups, Developed and Emerging, and three regions, Americas, EMEA, Asia, we get six market-regions.) Among Developed Market sectors, energy is 5th YTD, down about 5% less than the MSCI All Country World Index.

In North America, it is 7th best YTD.

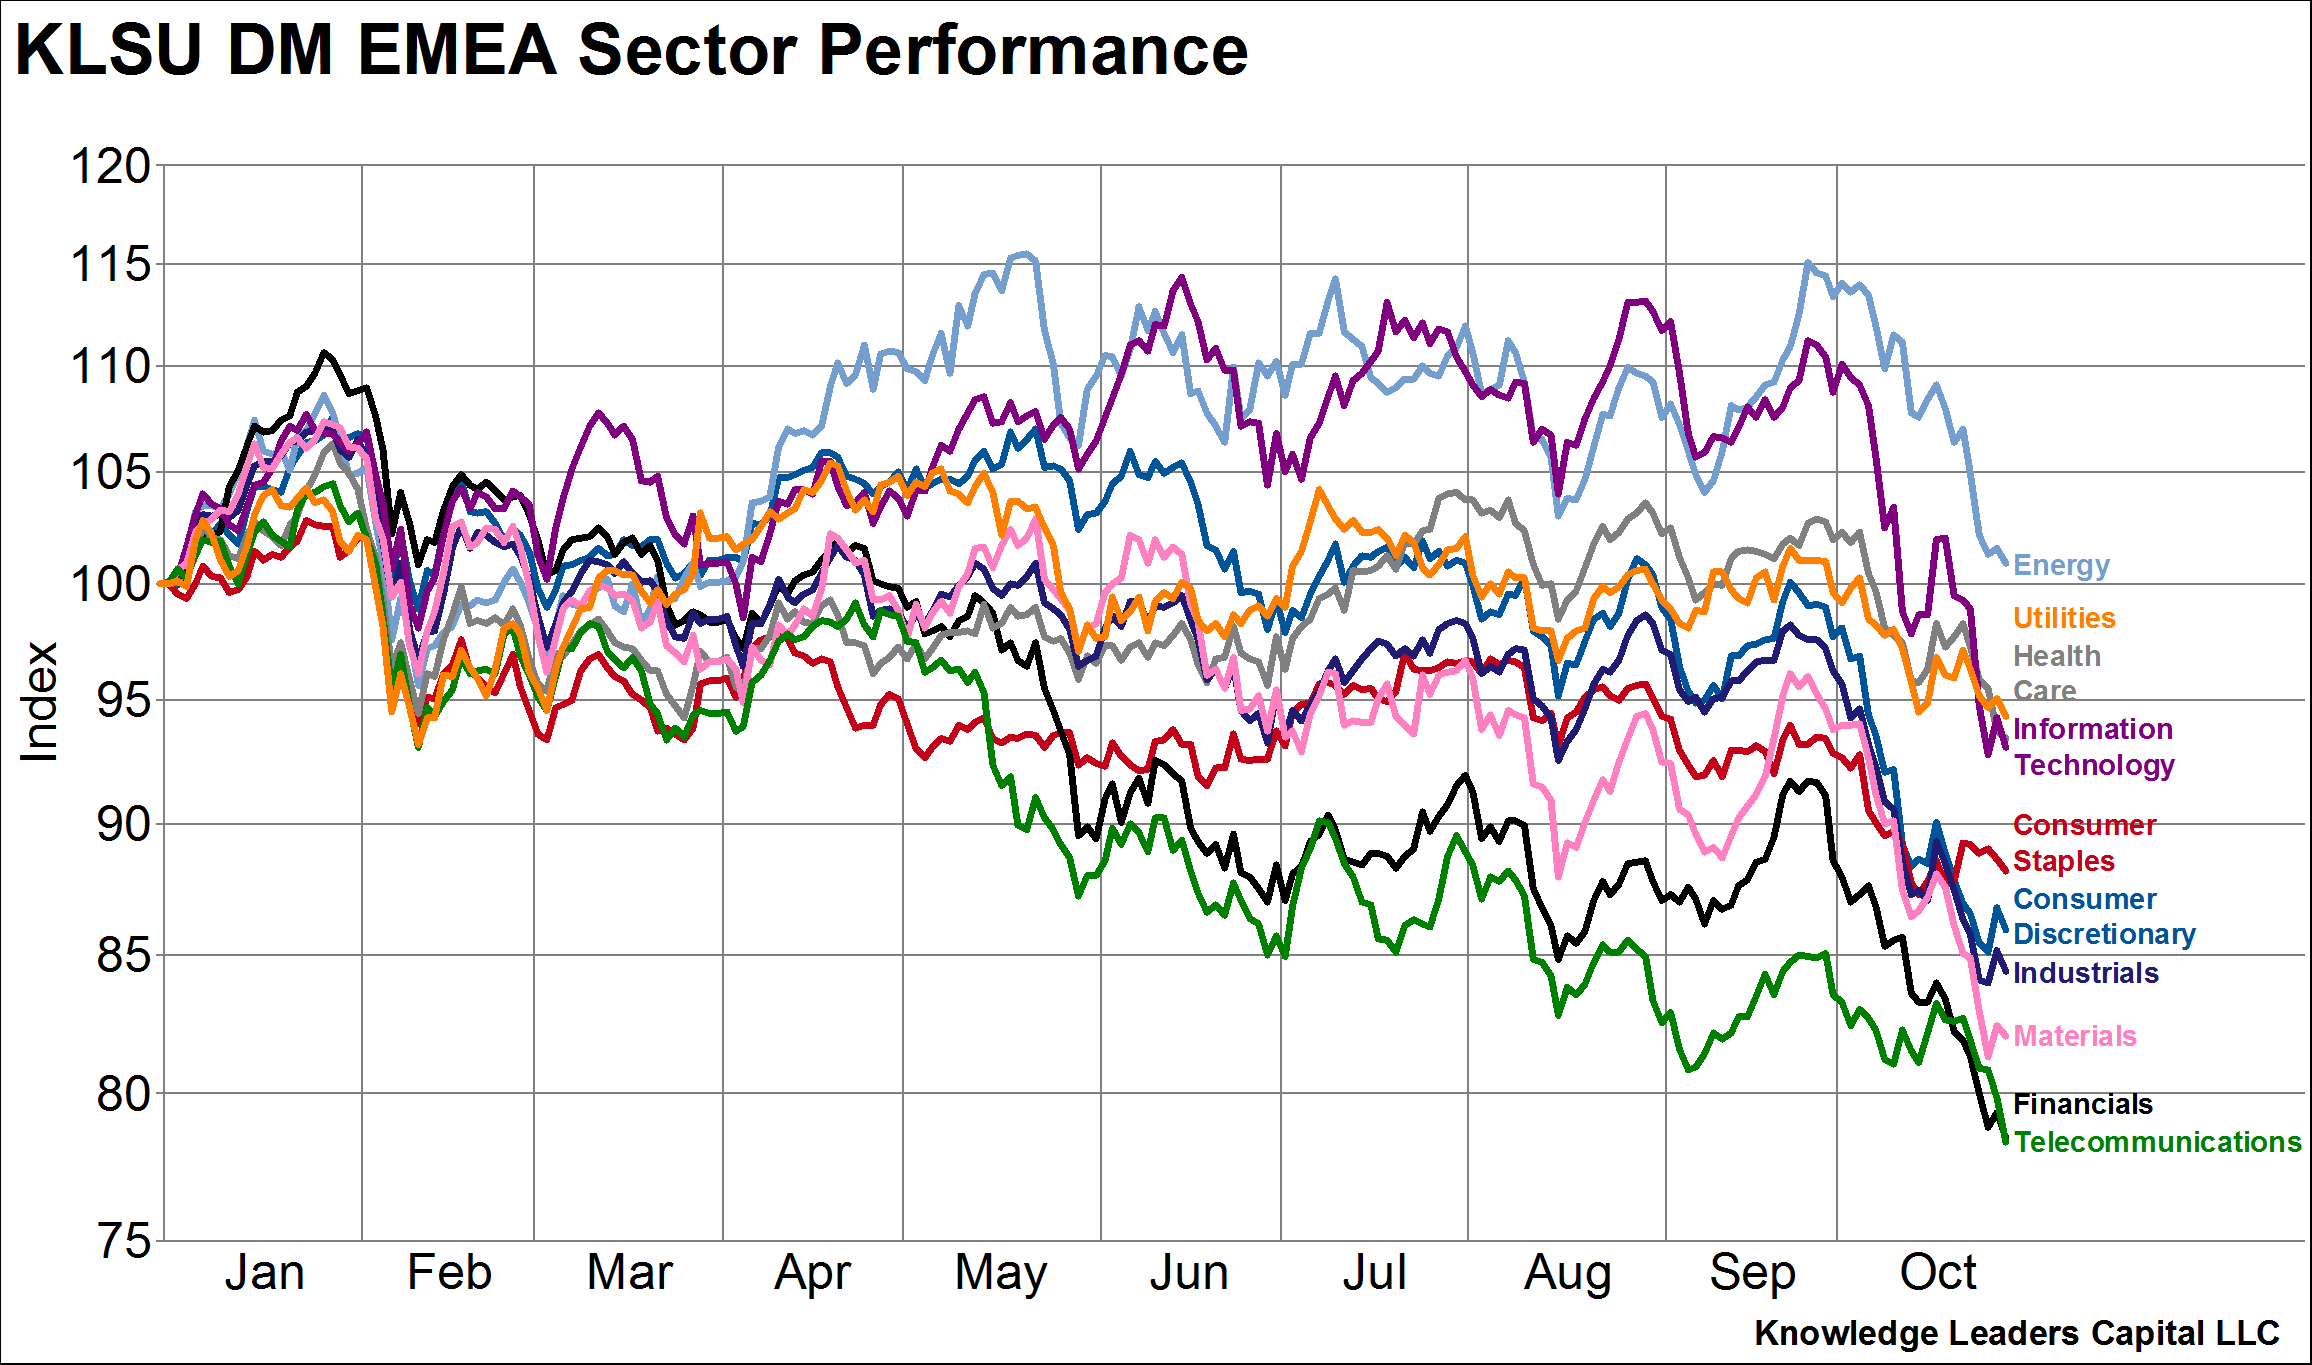
It is the best performing sector in Europe, and the only positive sector YTD.
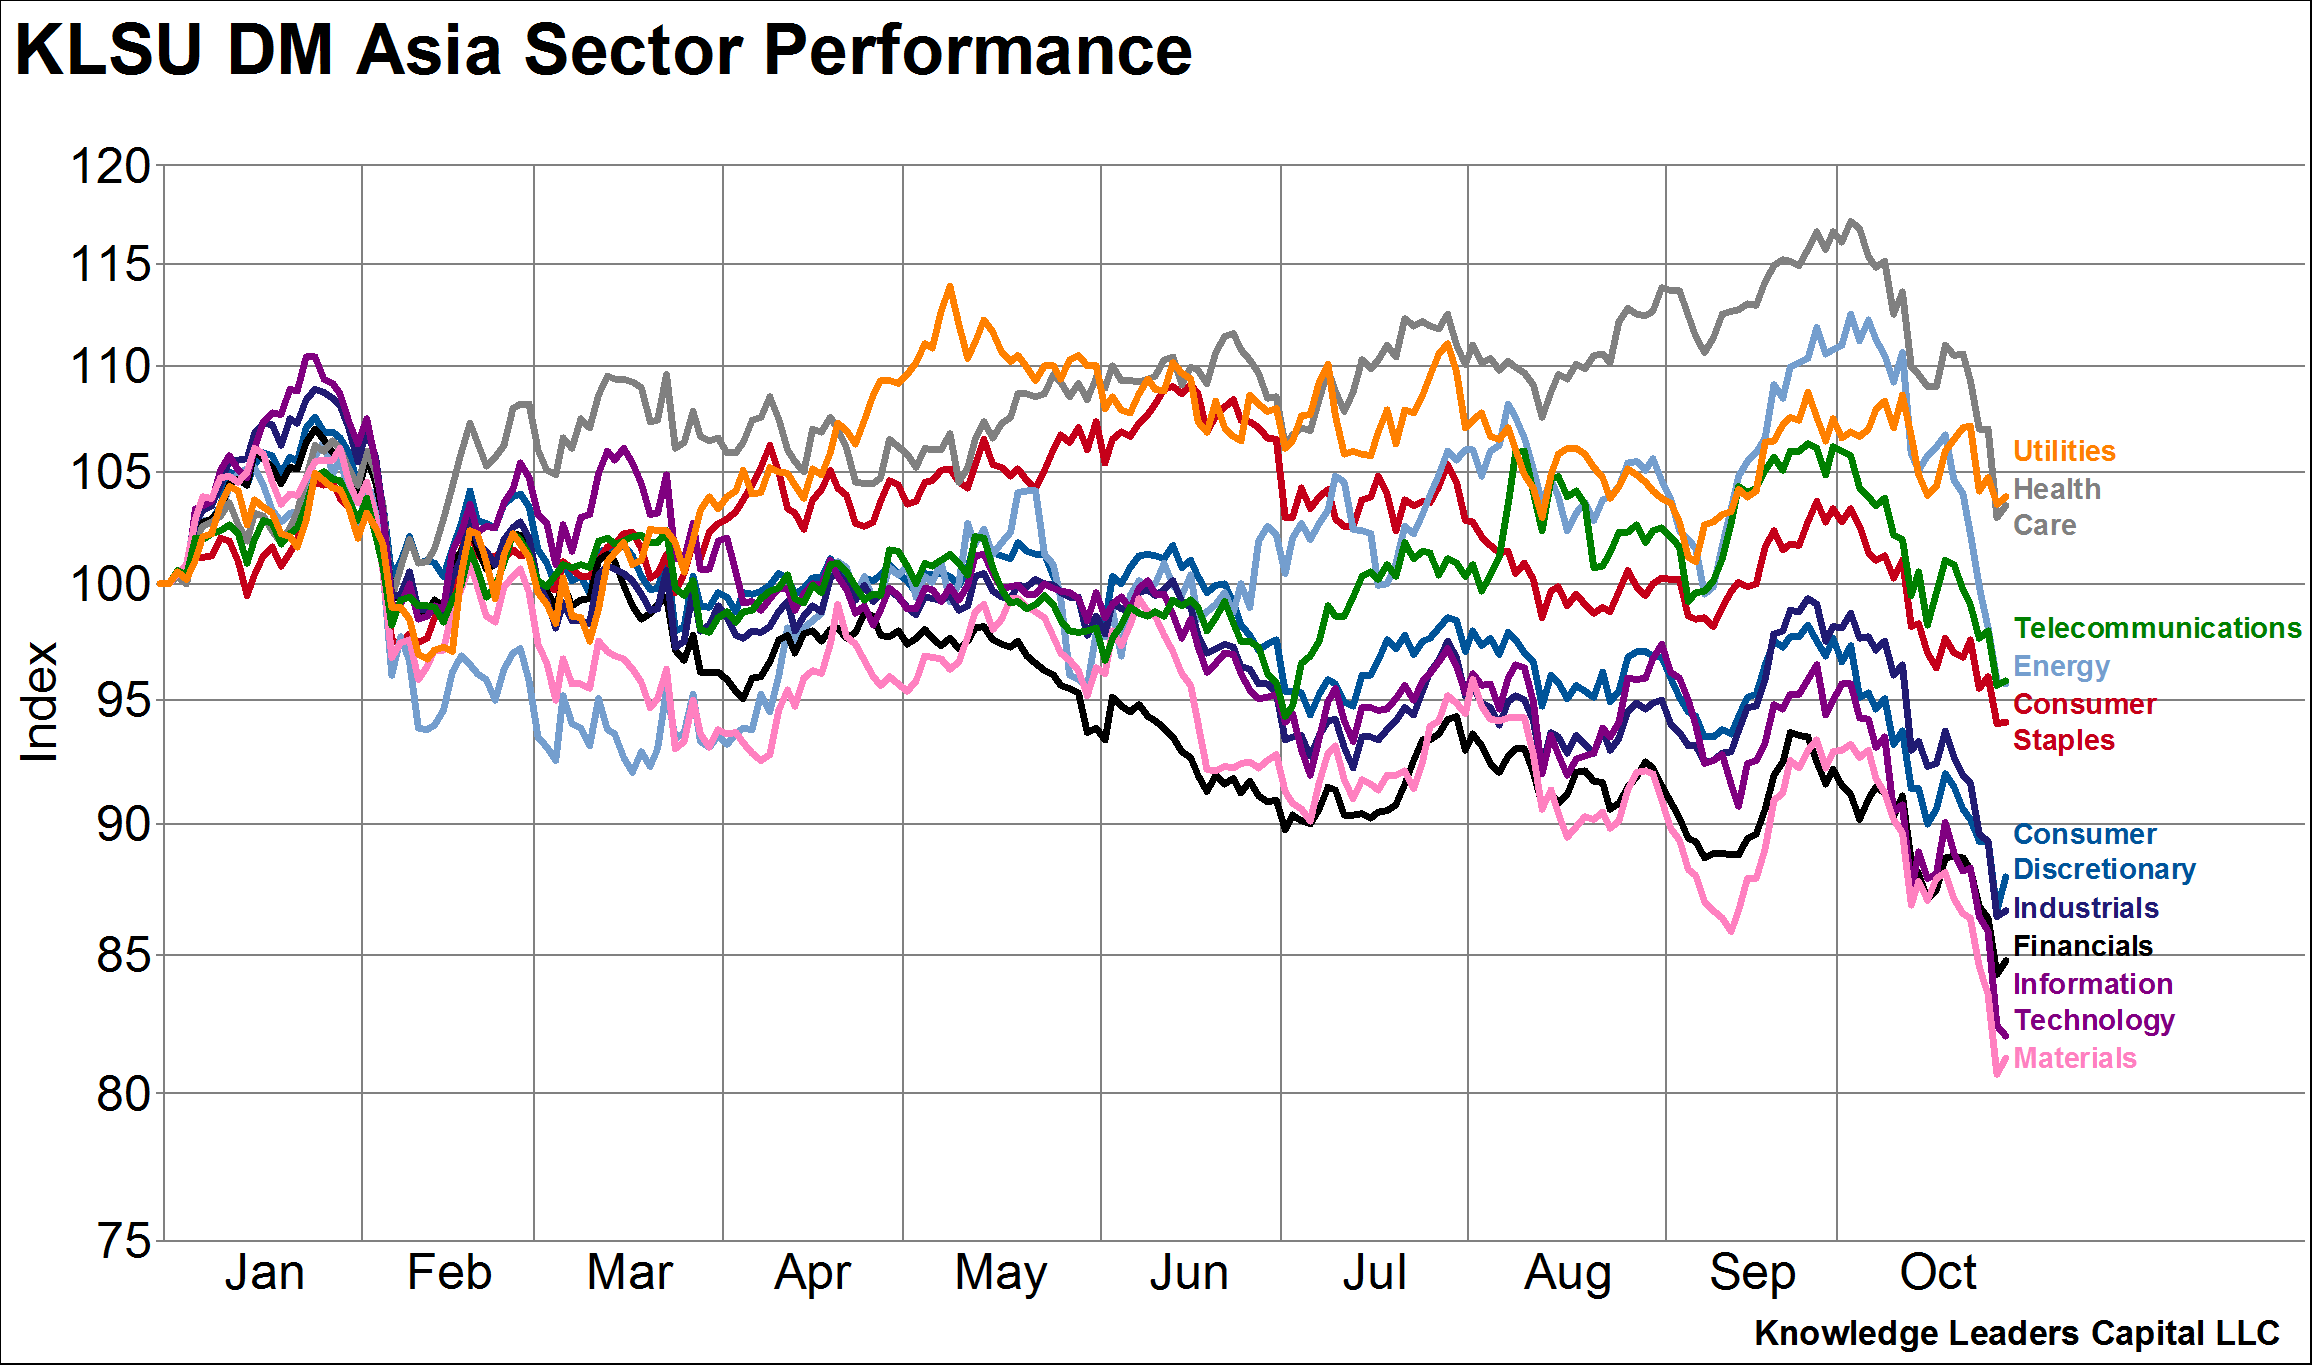
It is 4th best YTD in Developed Asia.
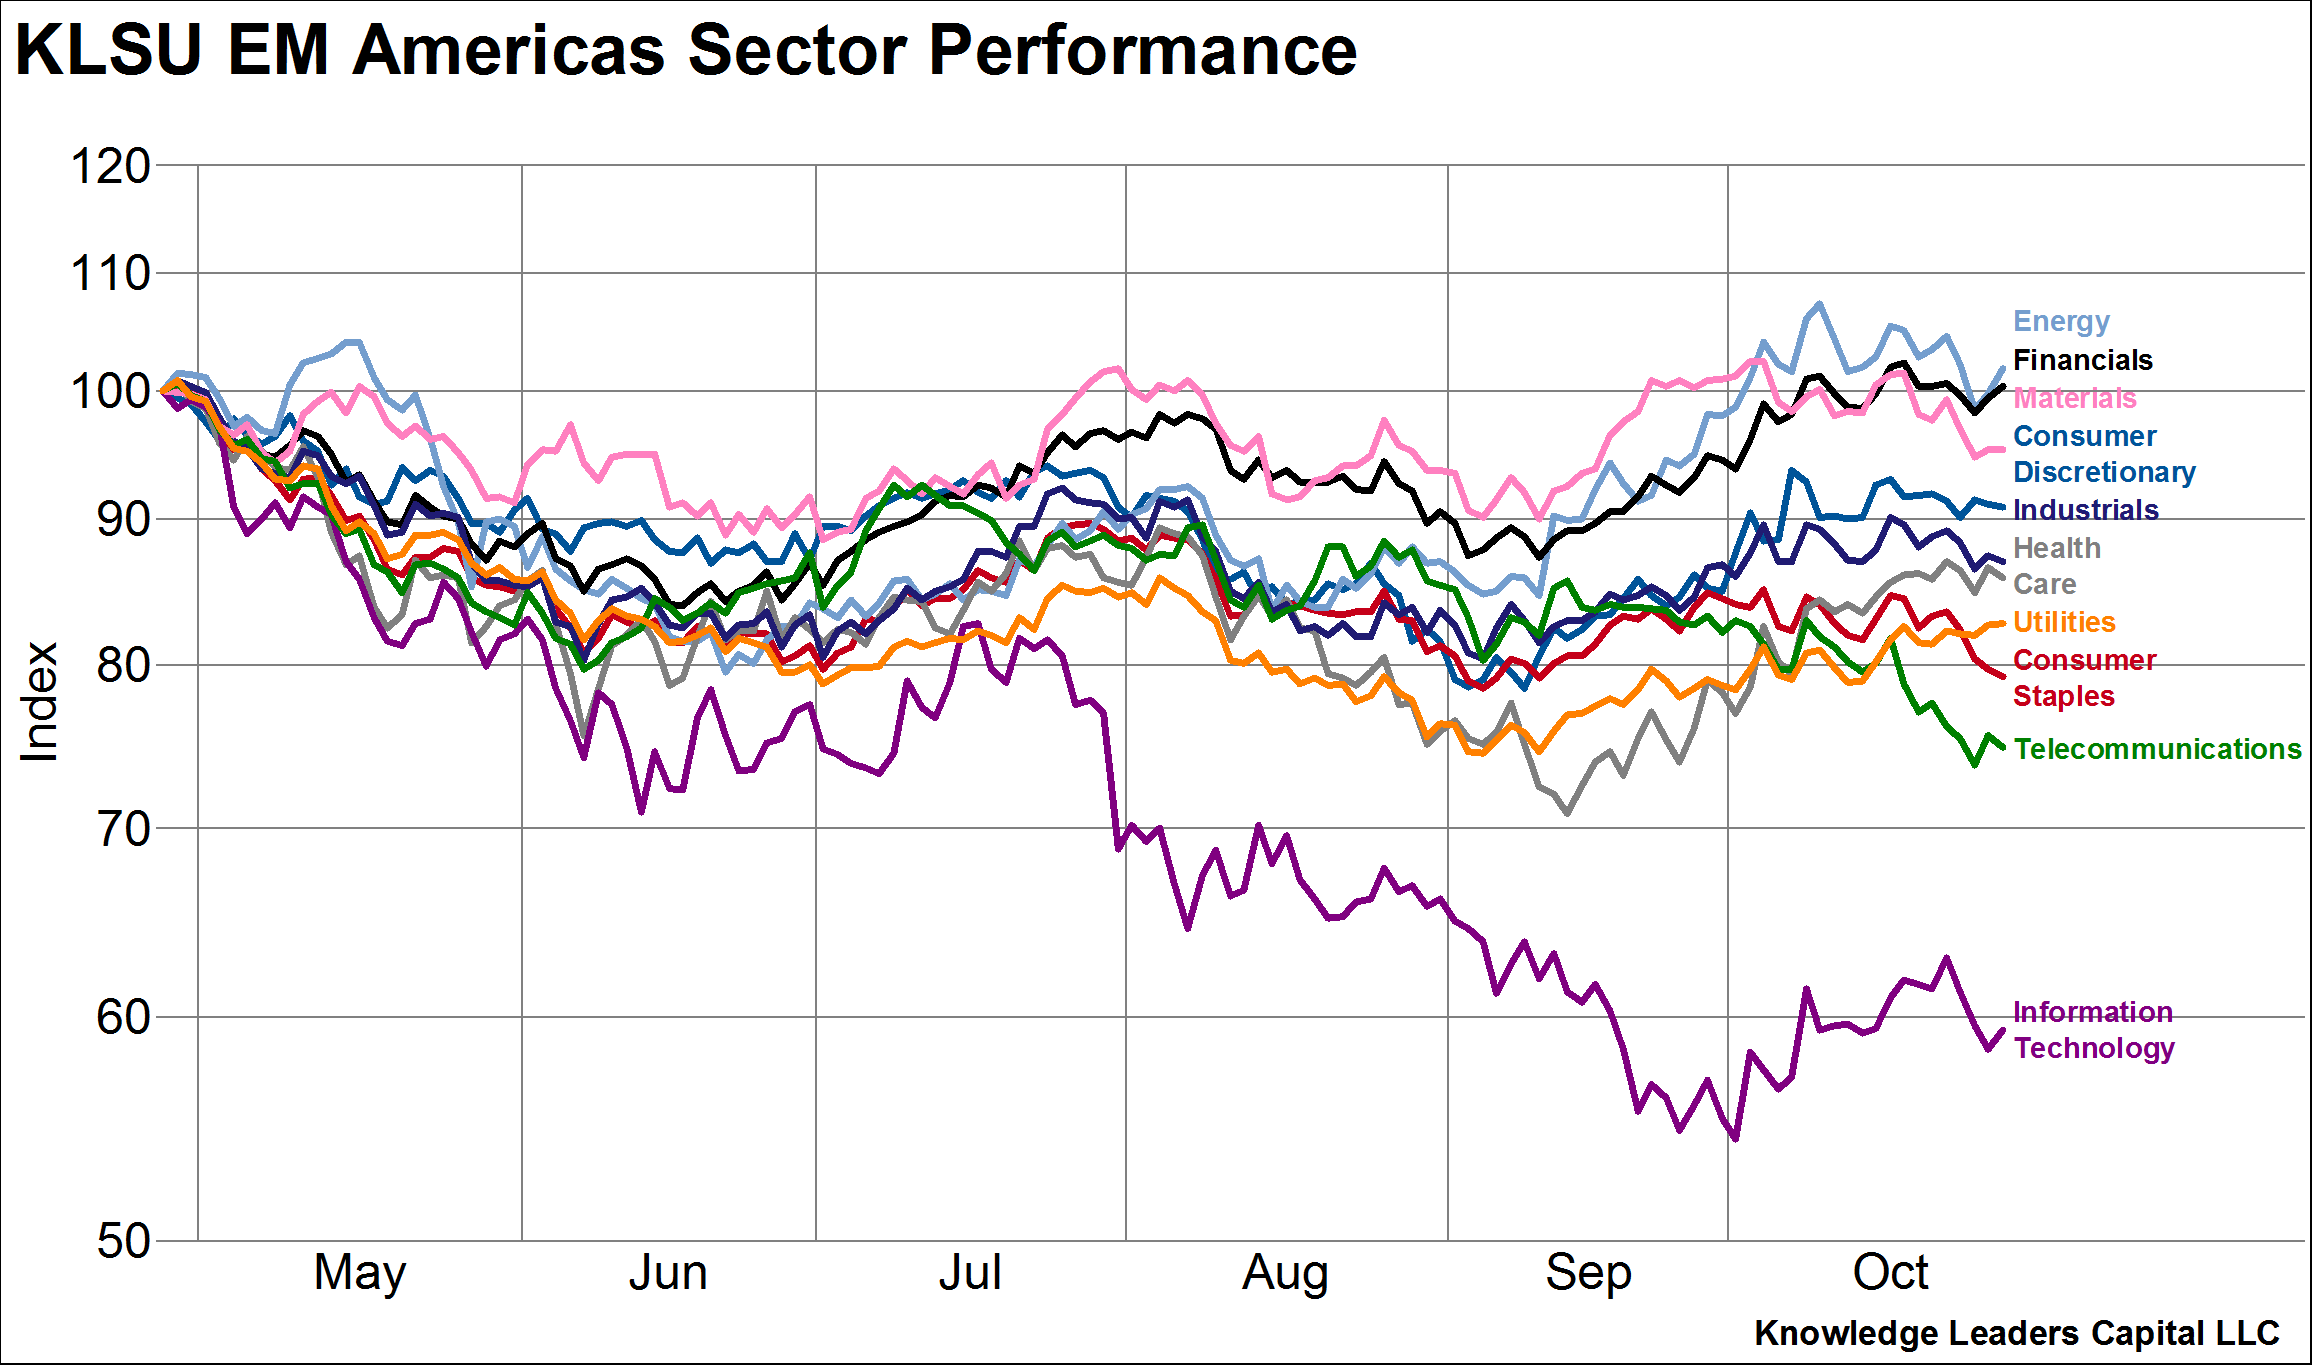
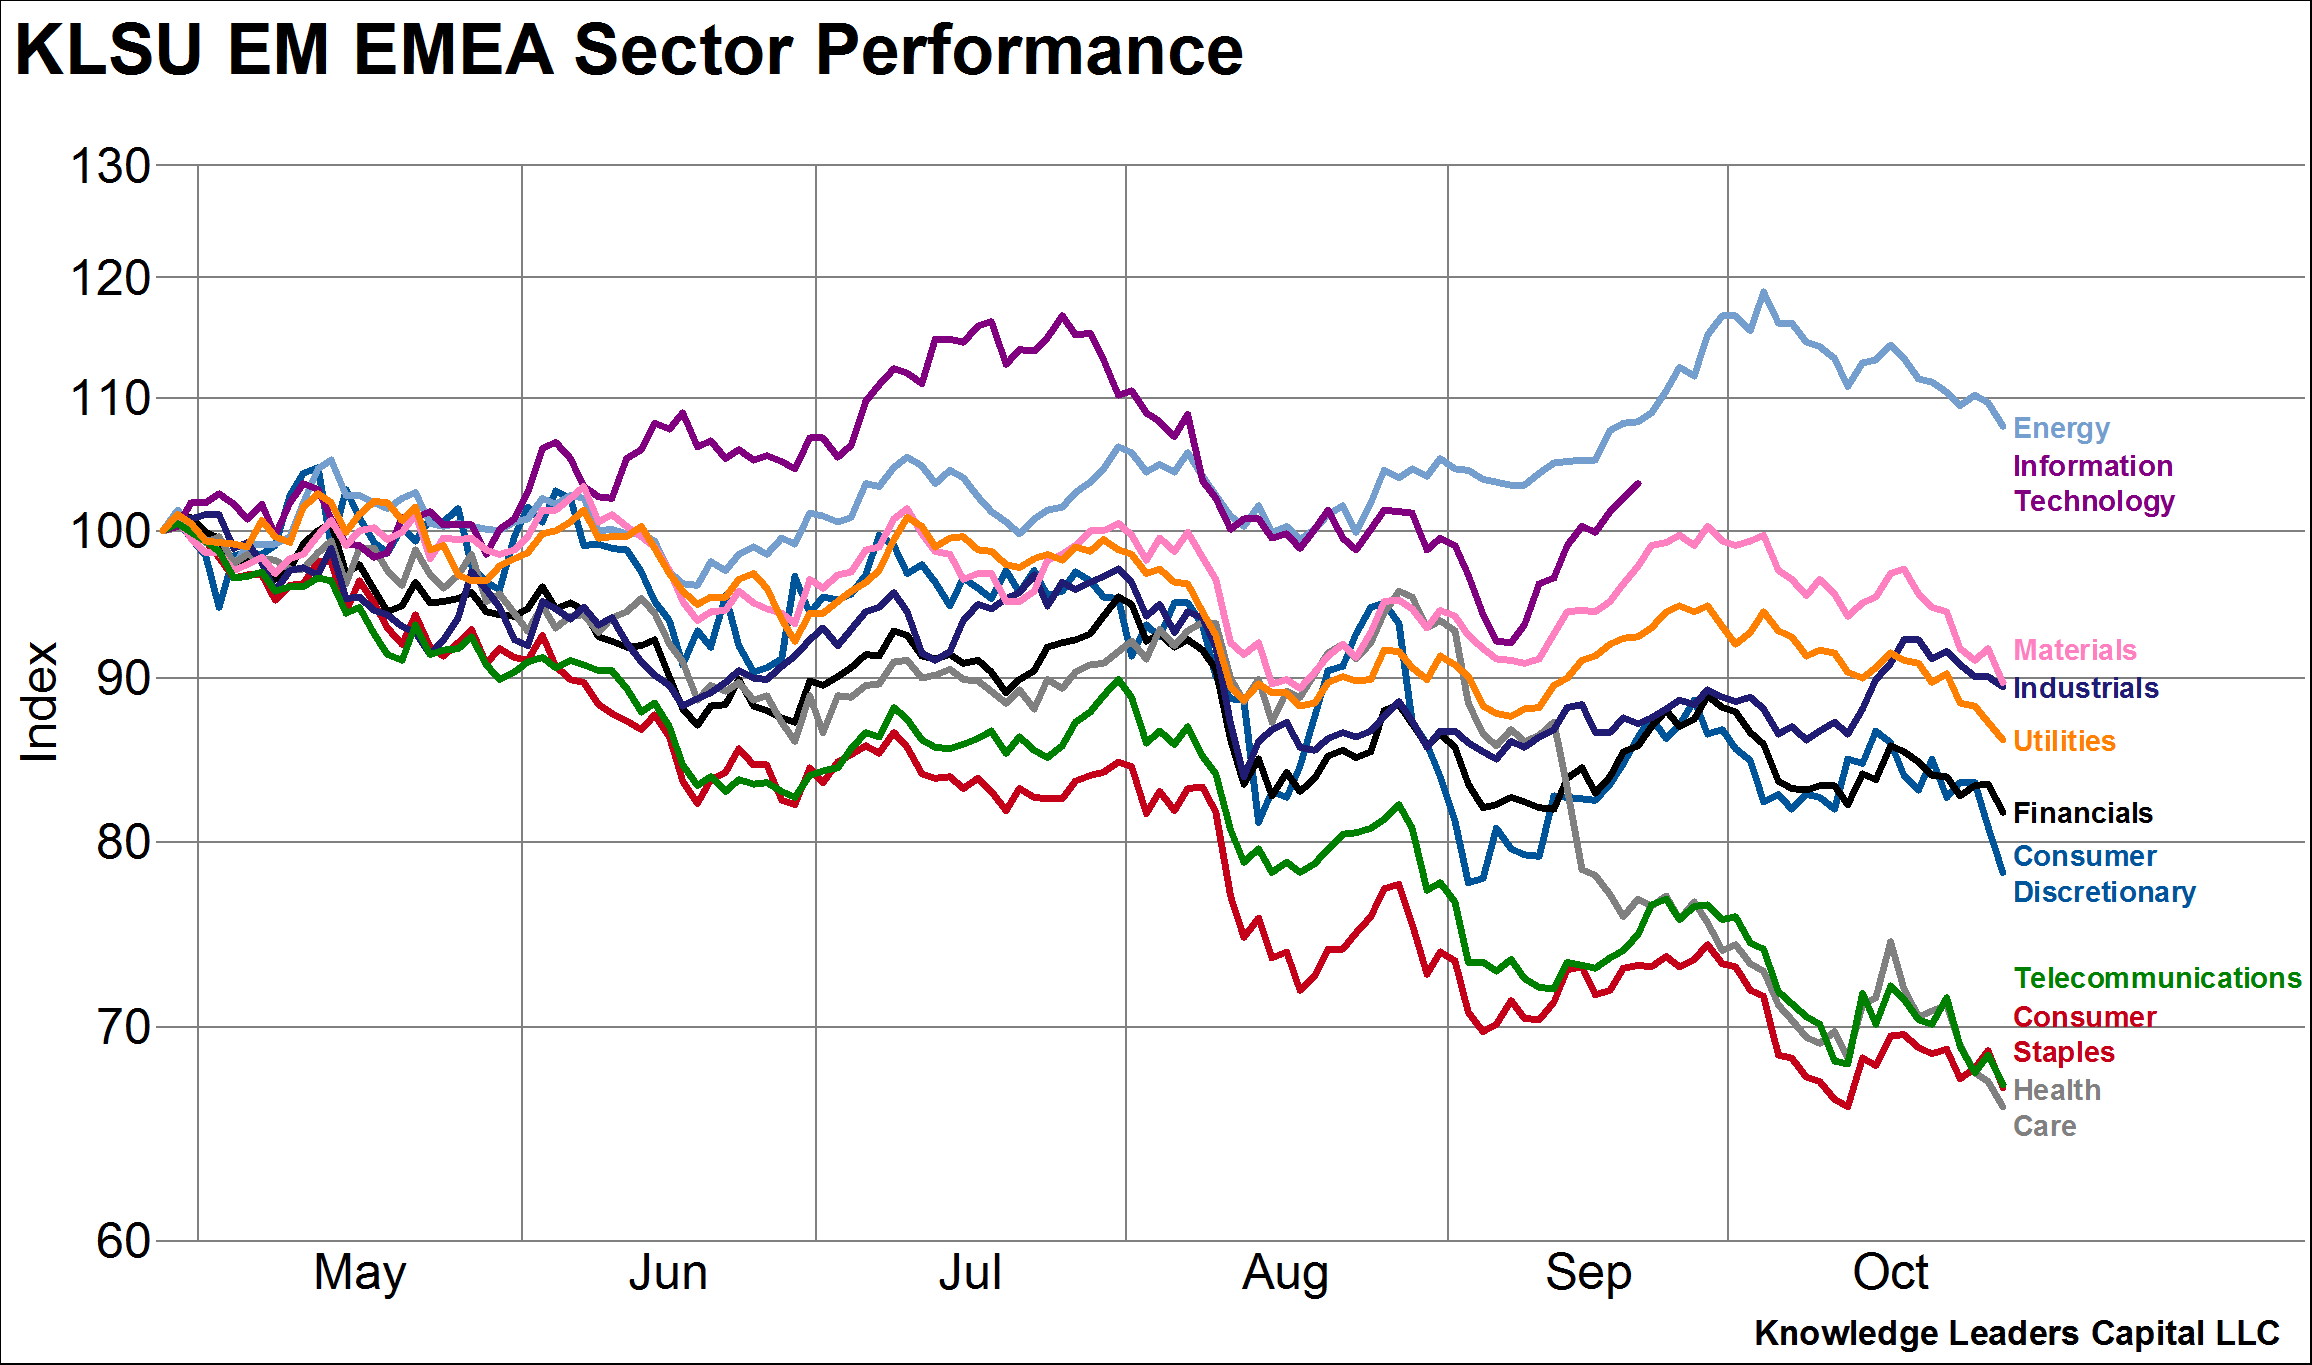
Energy is the best performer in the Emerging Markets YTD by almost 20%. It is the only sector up YTD in the Emerging Markets.

It leads in Emerging Americas.
And Emerging EMEA too.
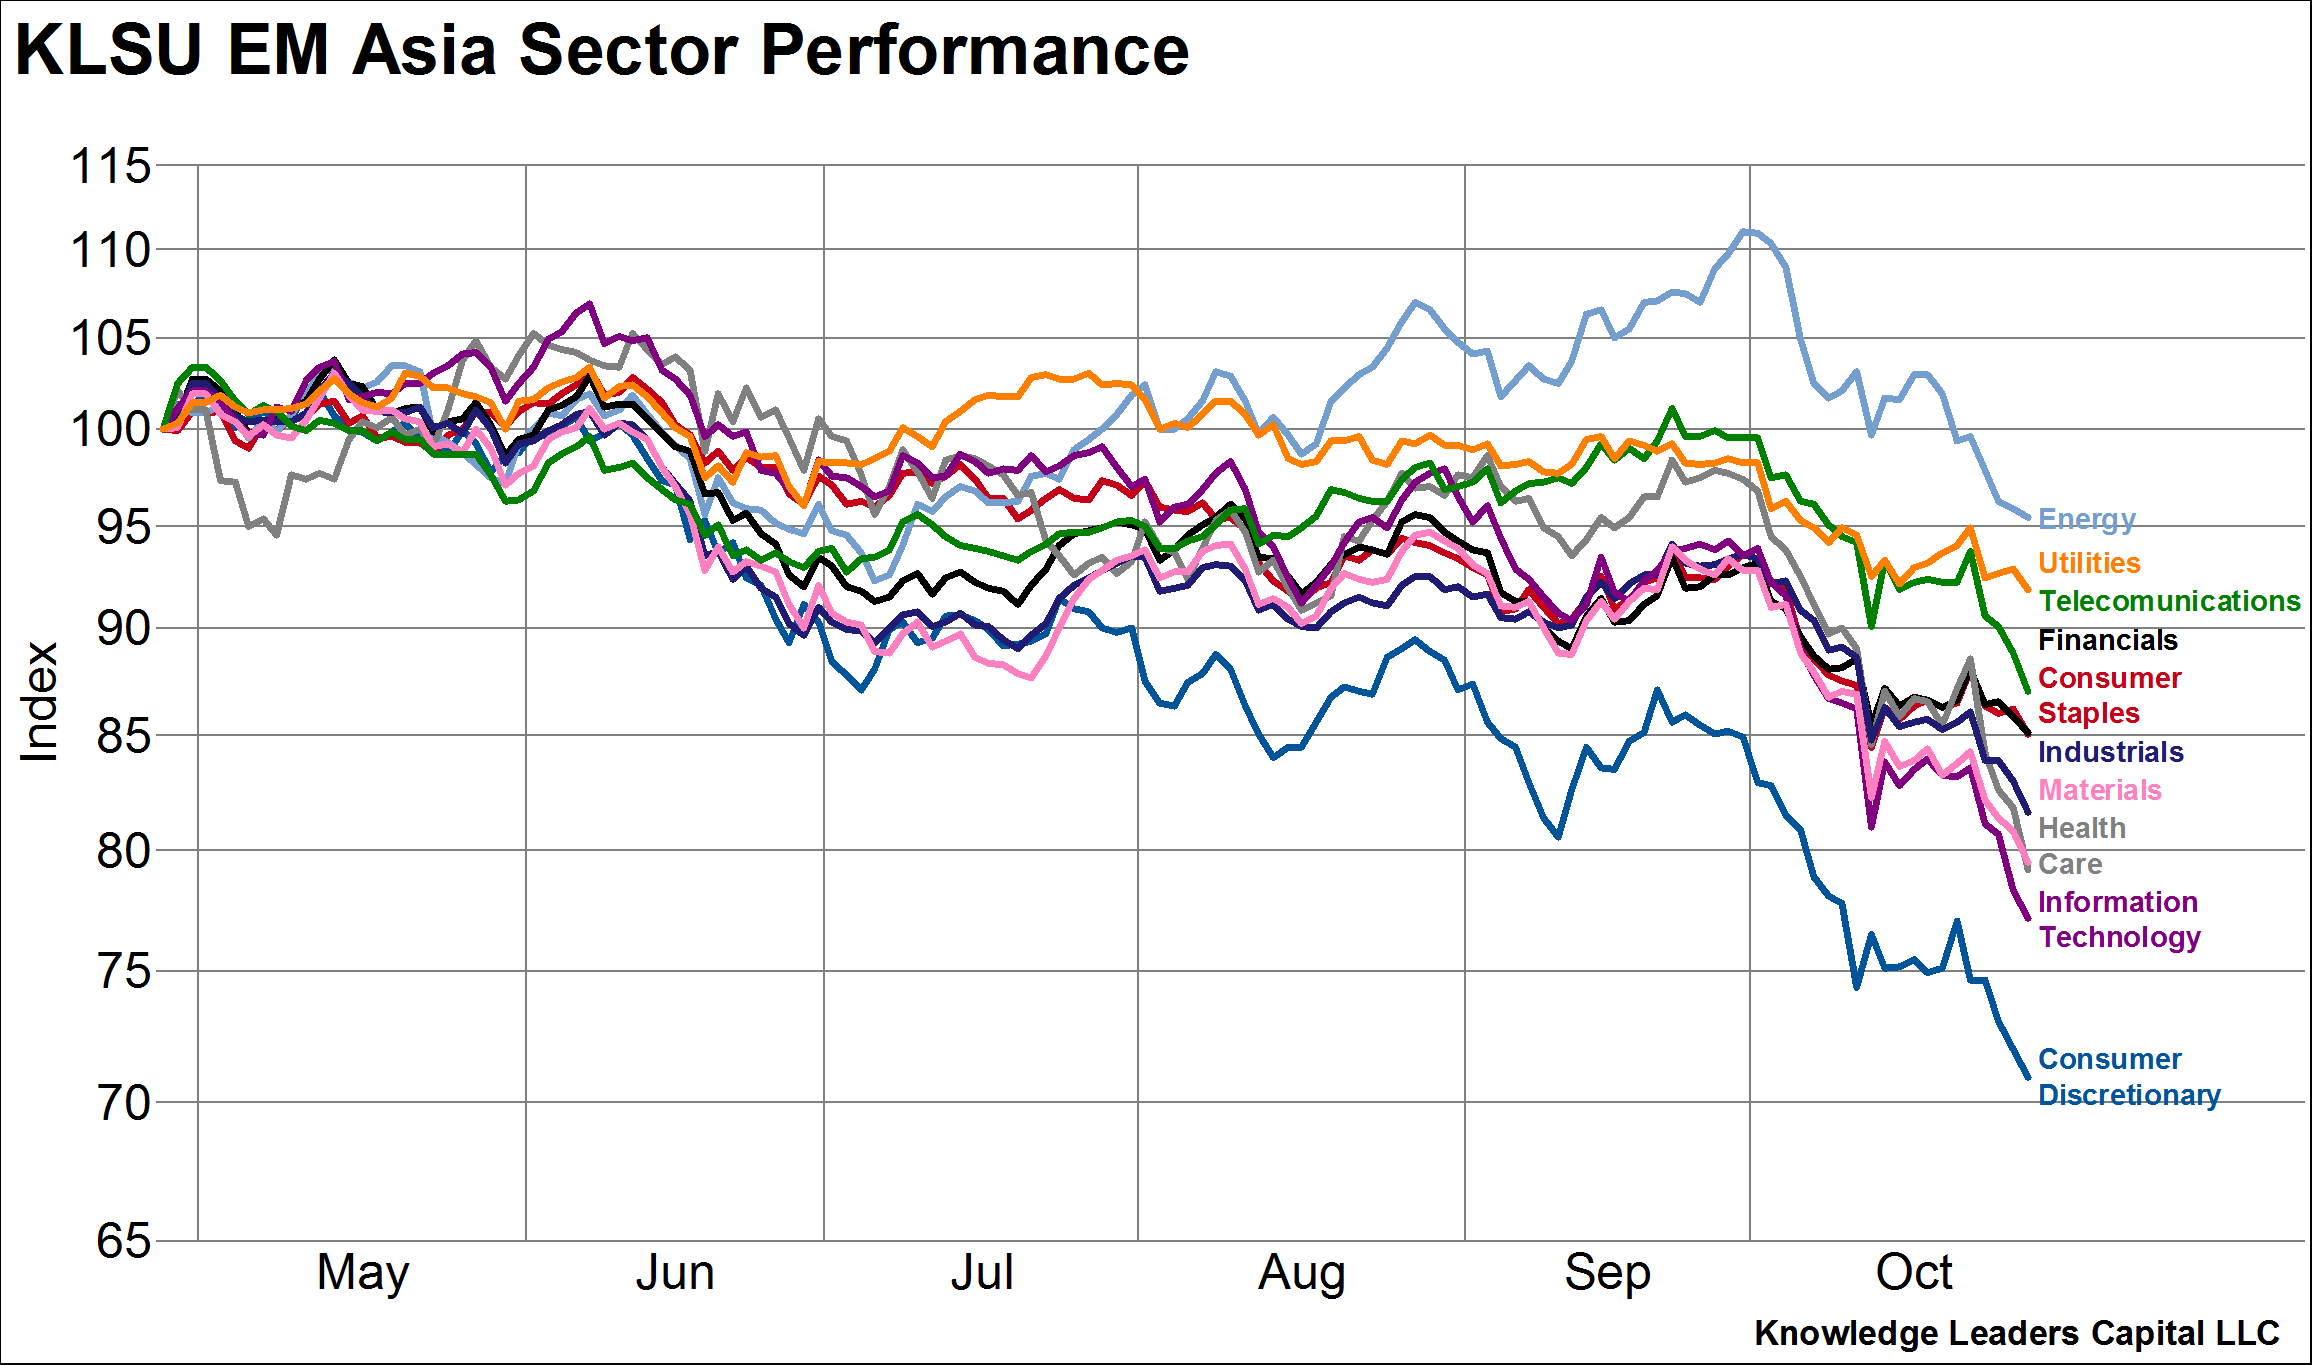
Energy leads in Emerging Asia also.
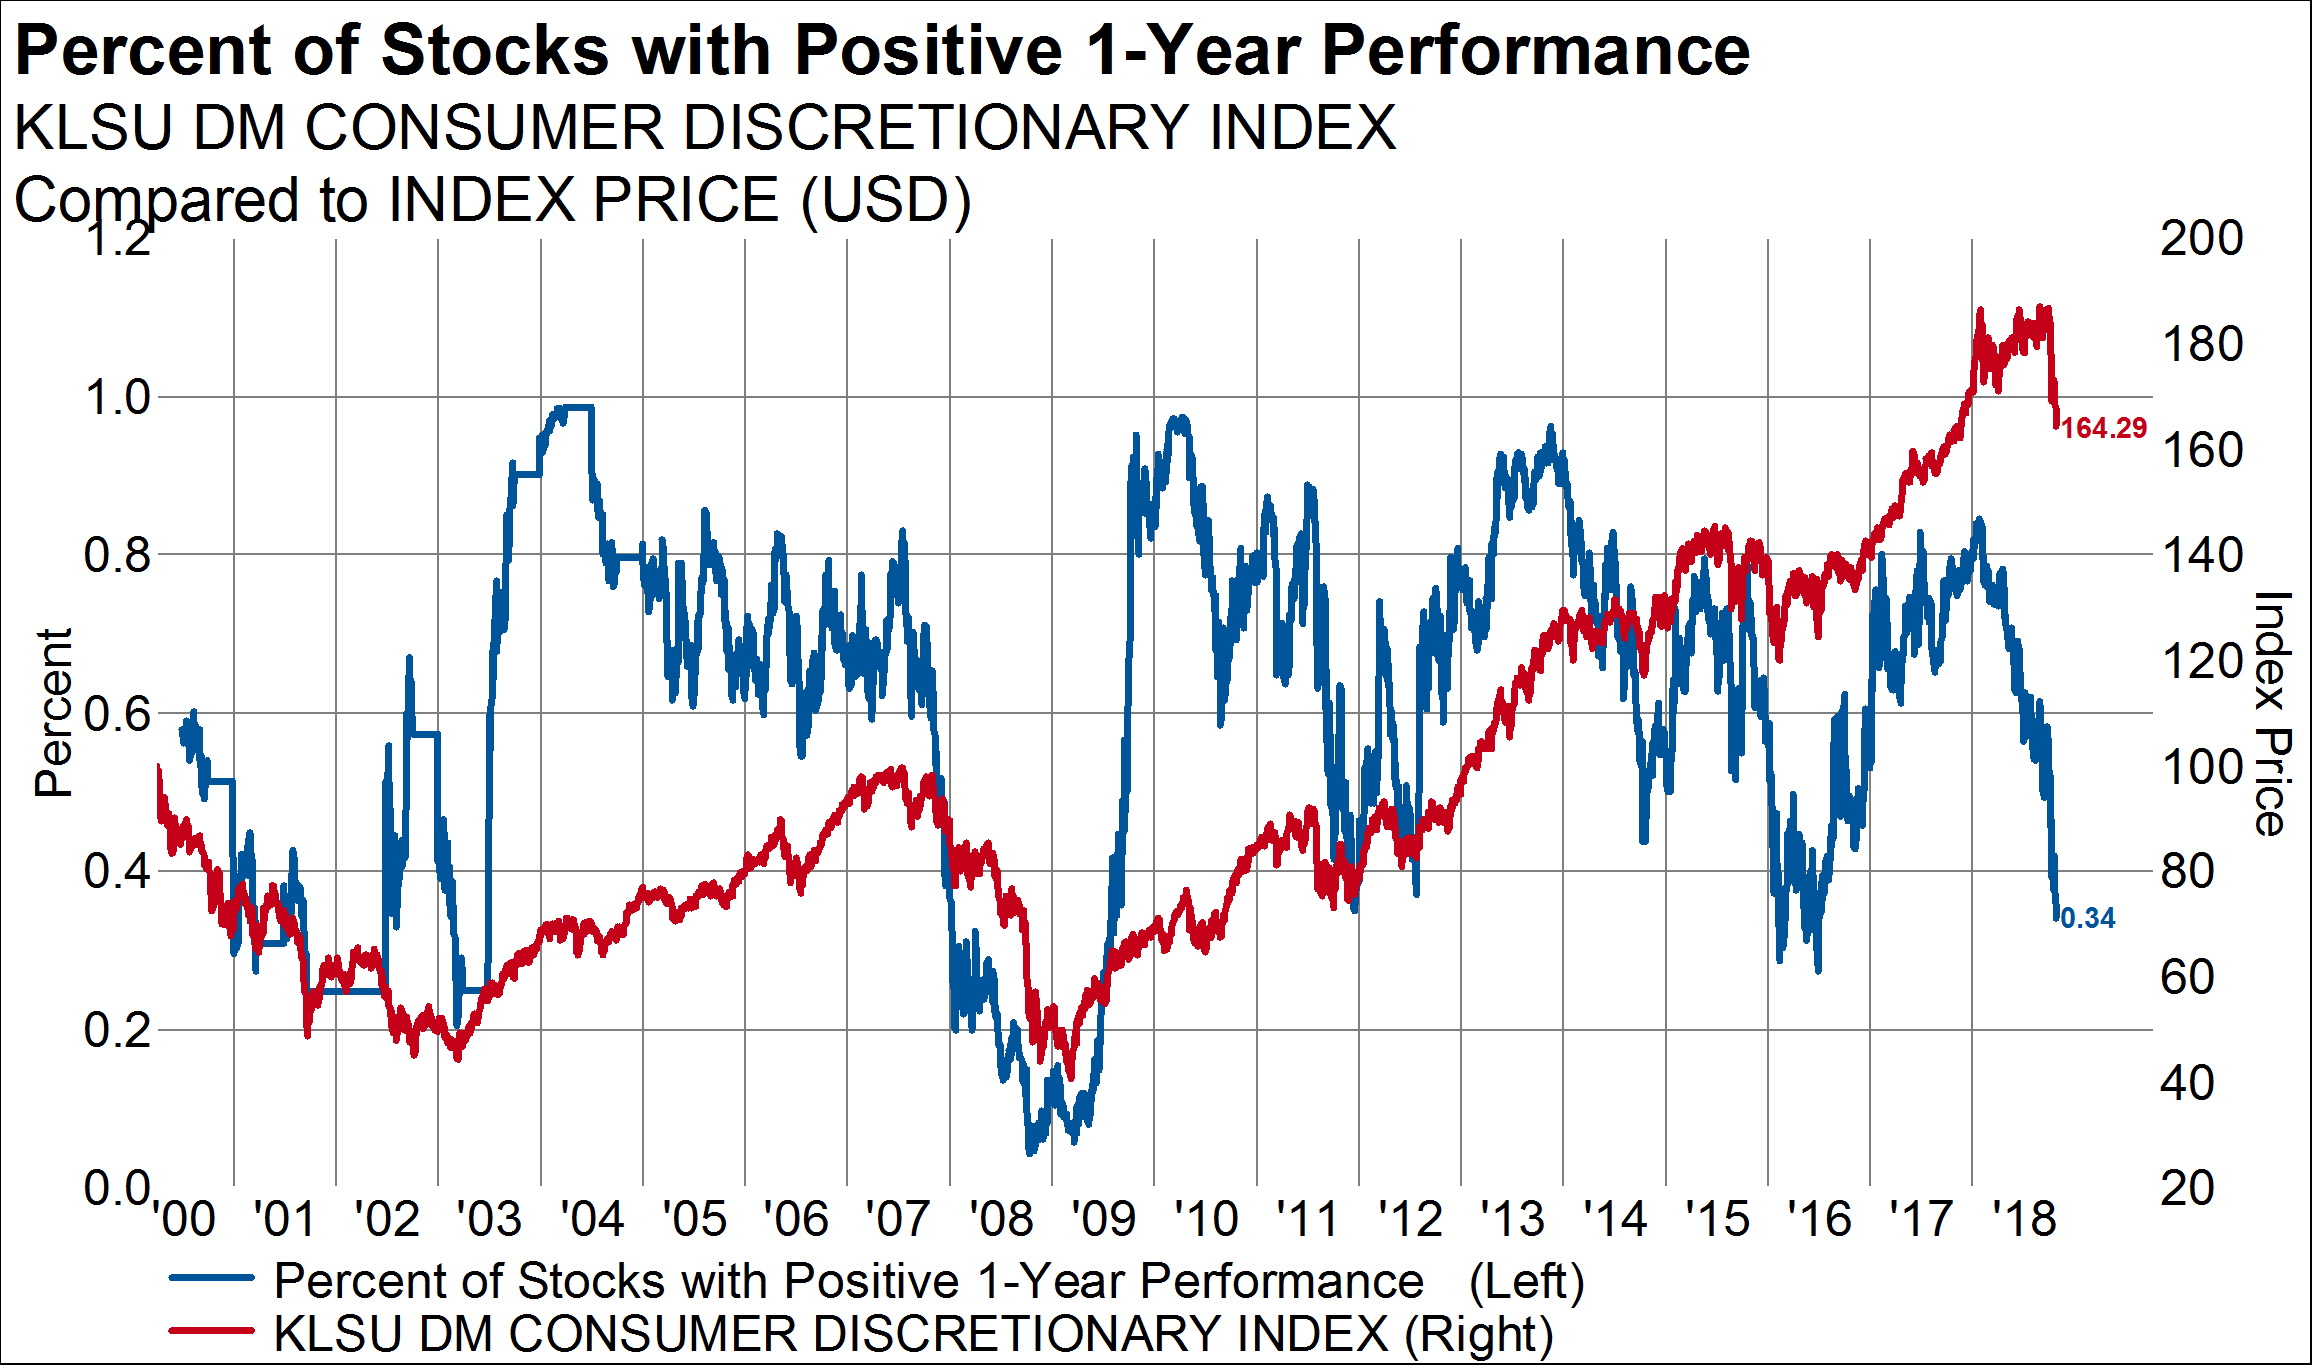
Next, if we look at the percent of companies with positive performance over one year, energy displays positive breadth characteristics.
Thirty-four percent of Developed consumer discretionary companies have positive returns over the last year.
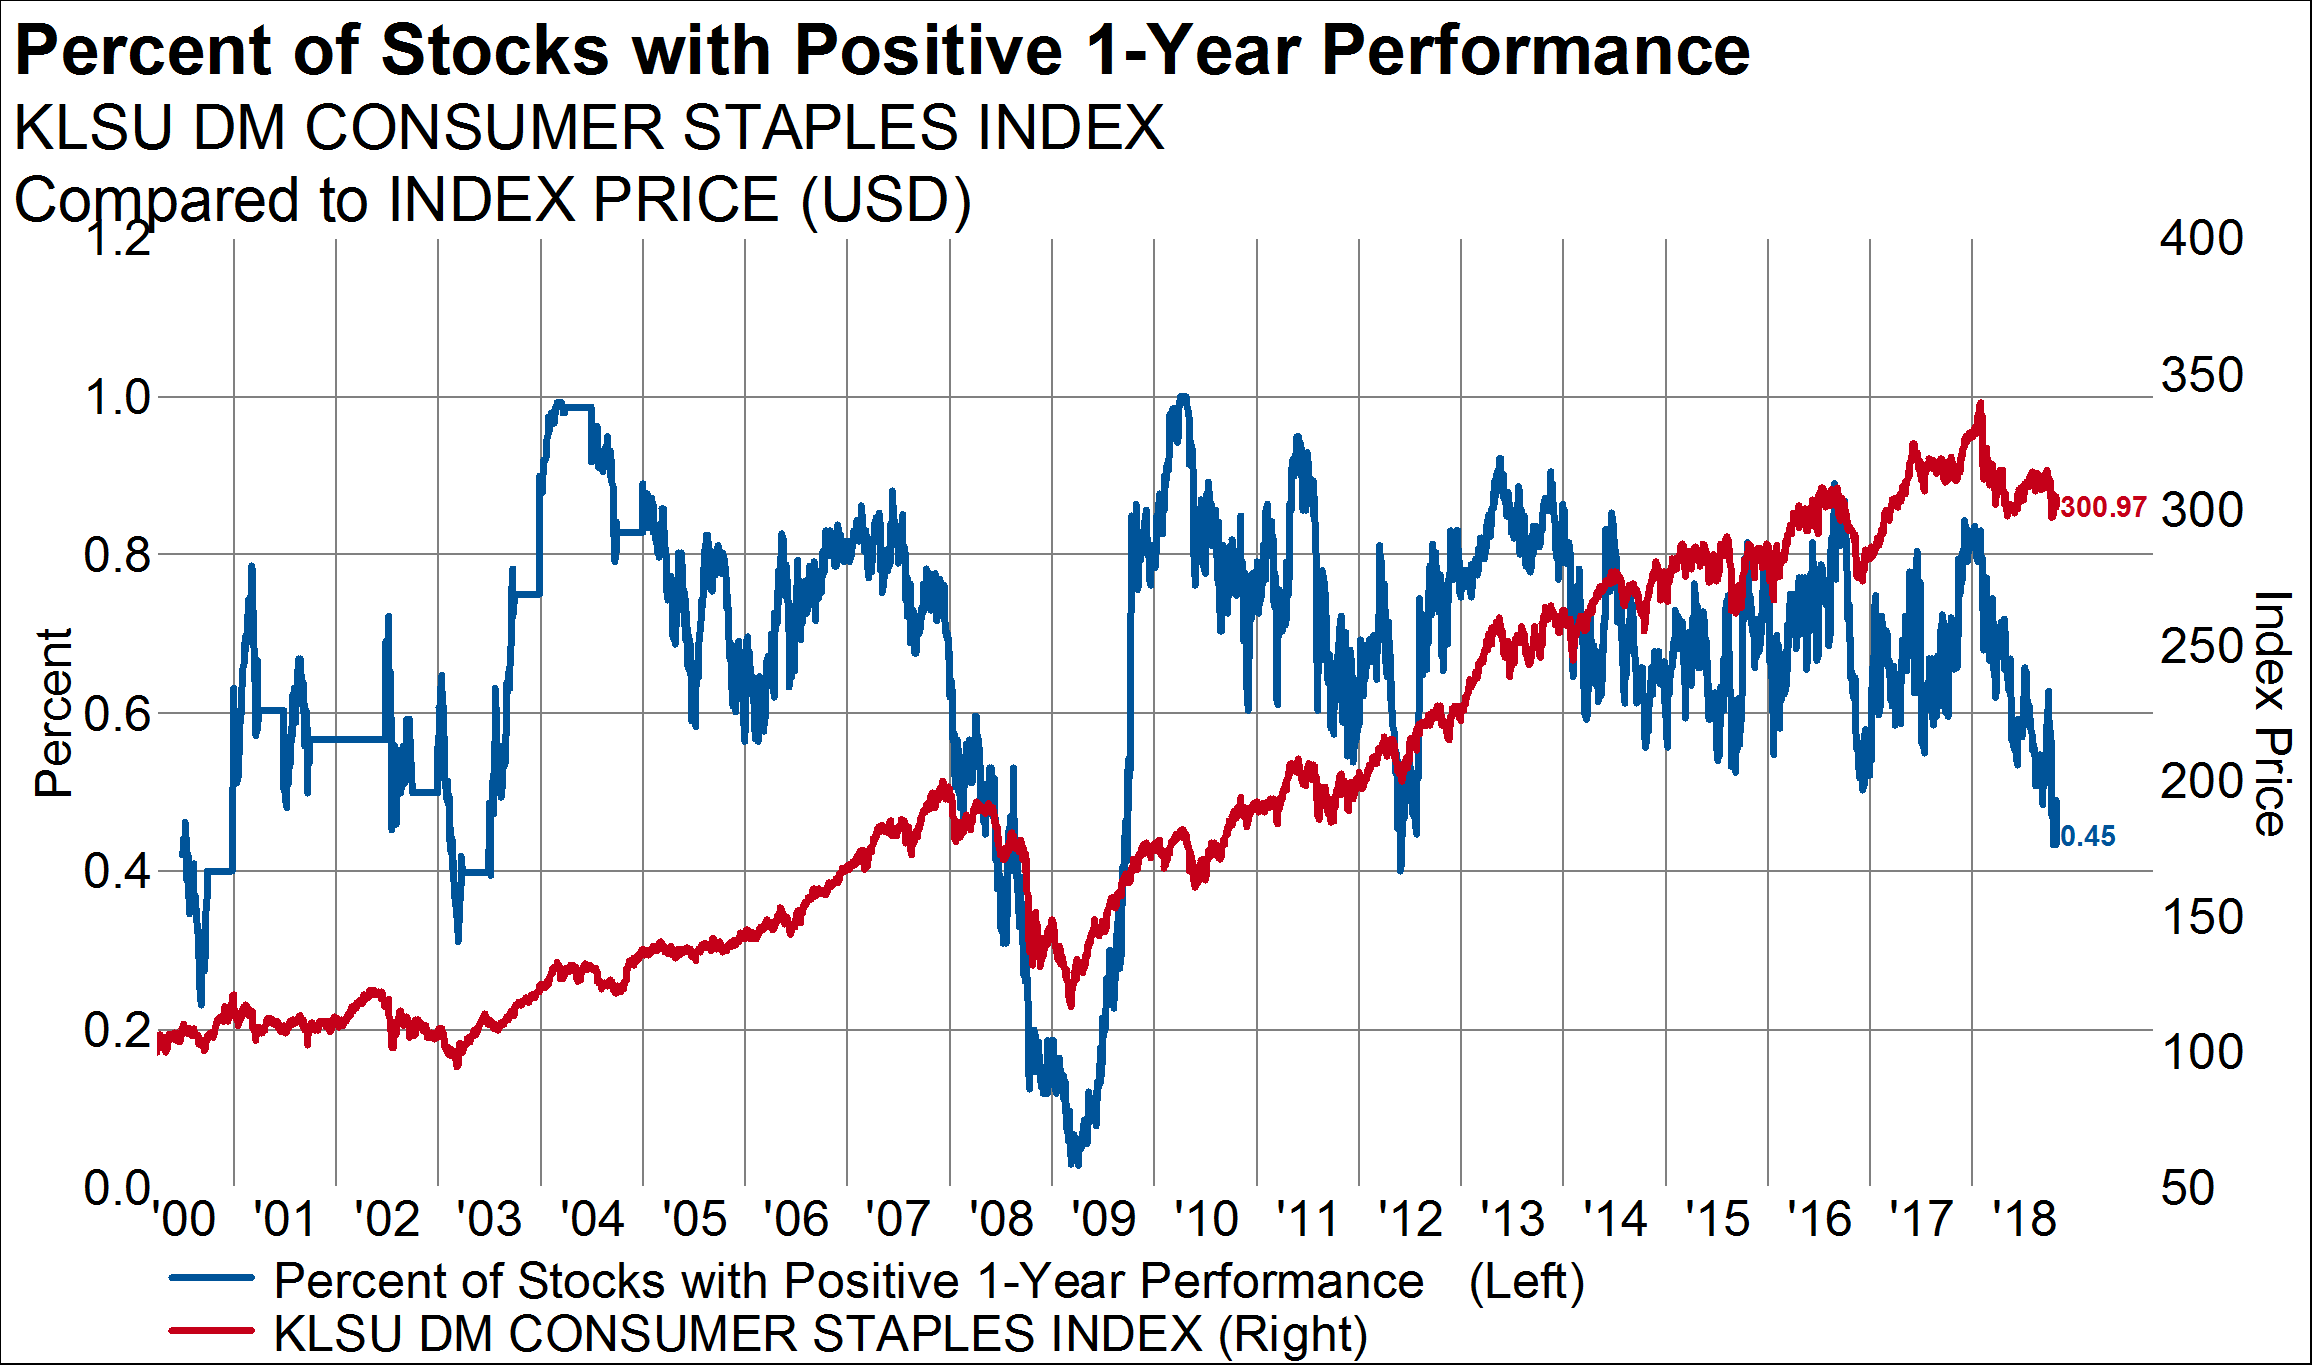
Forty-five percent of consumer staples are outperforming.
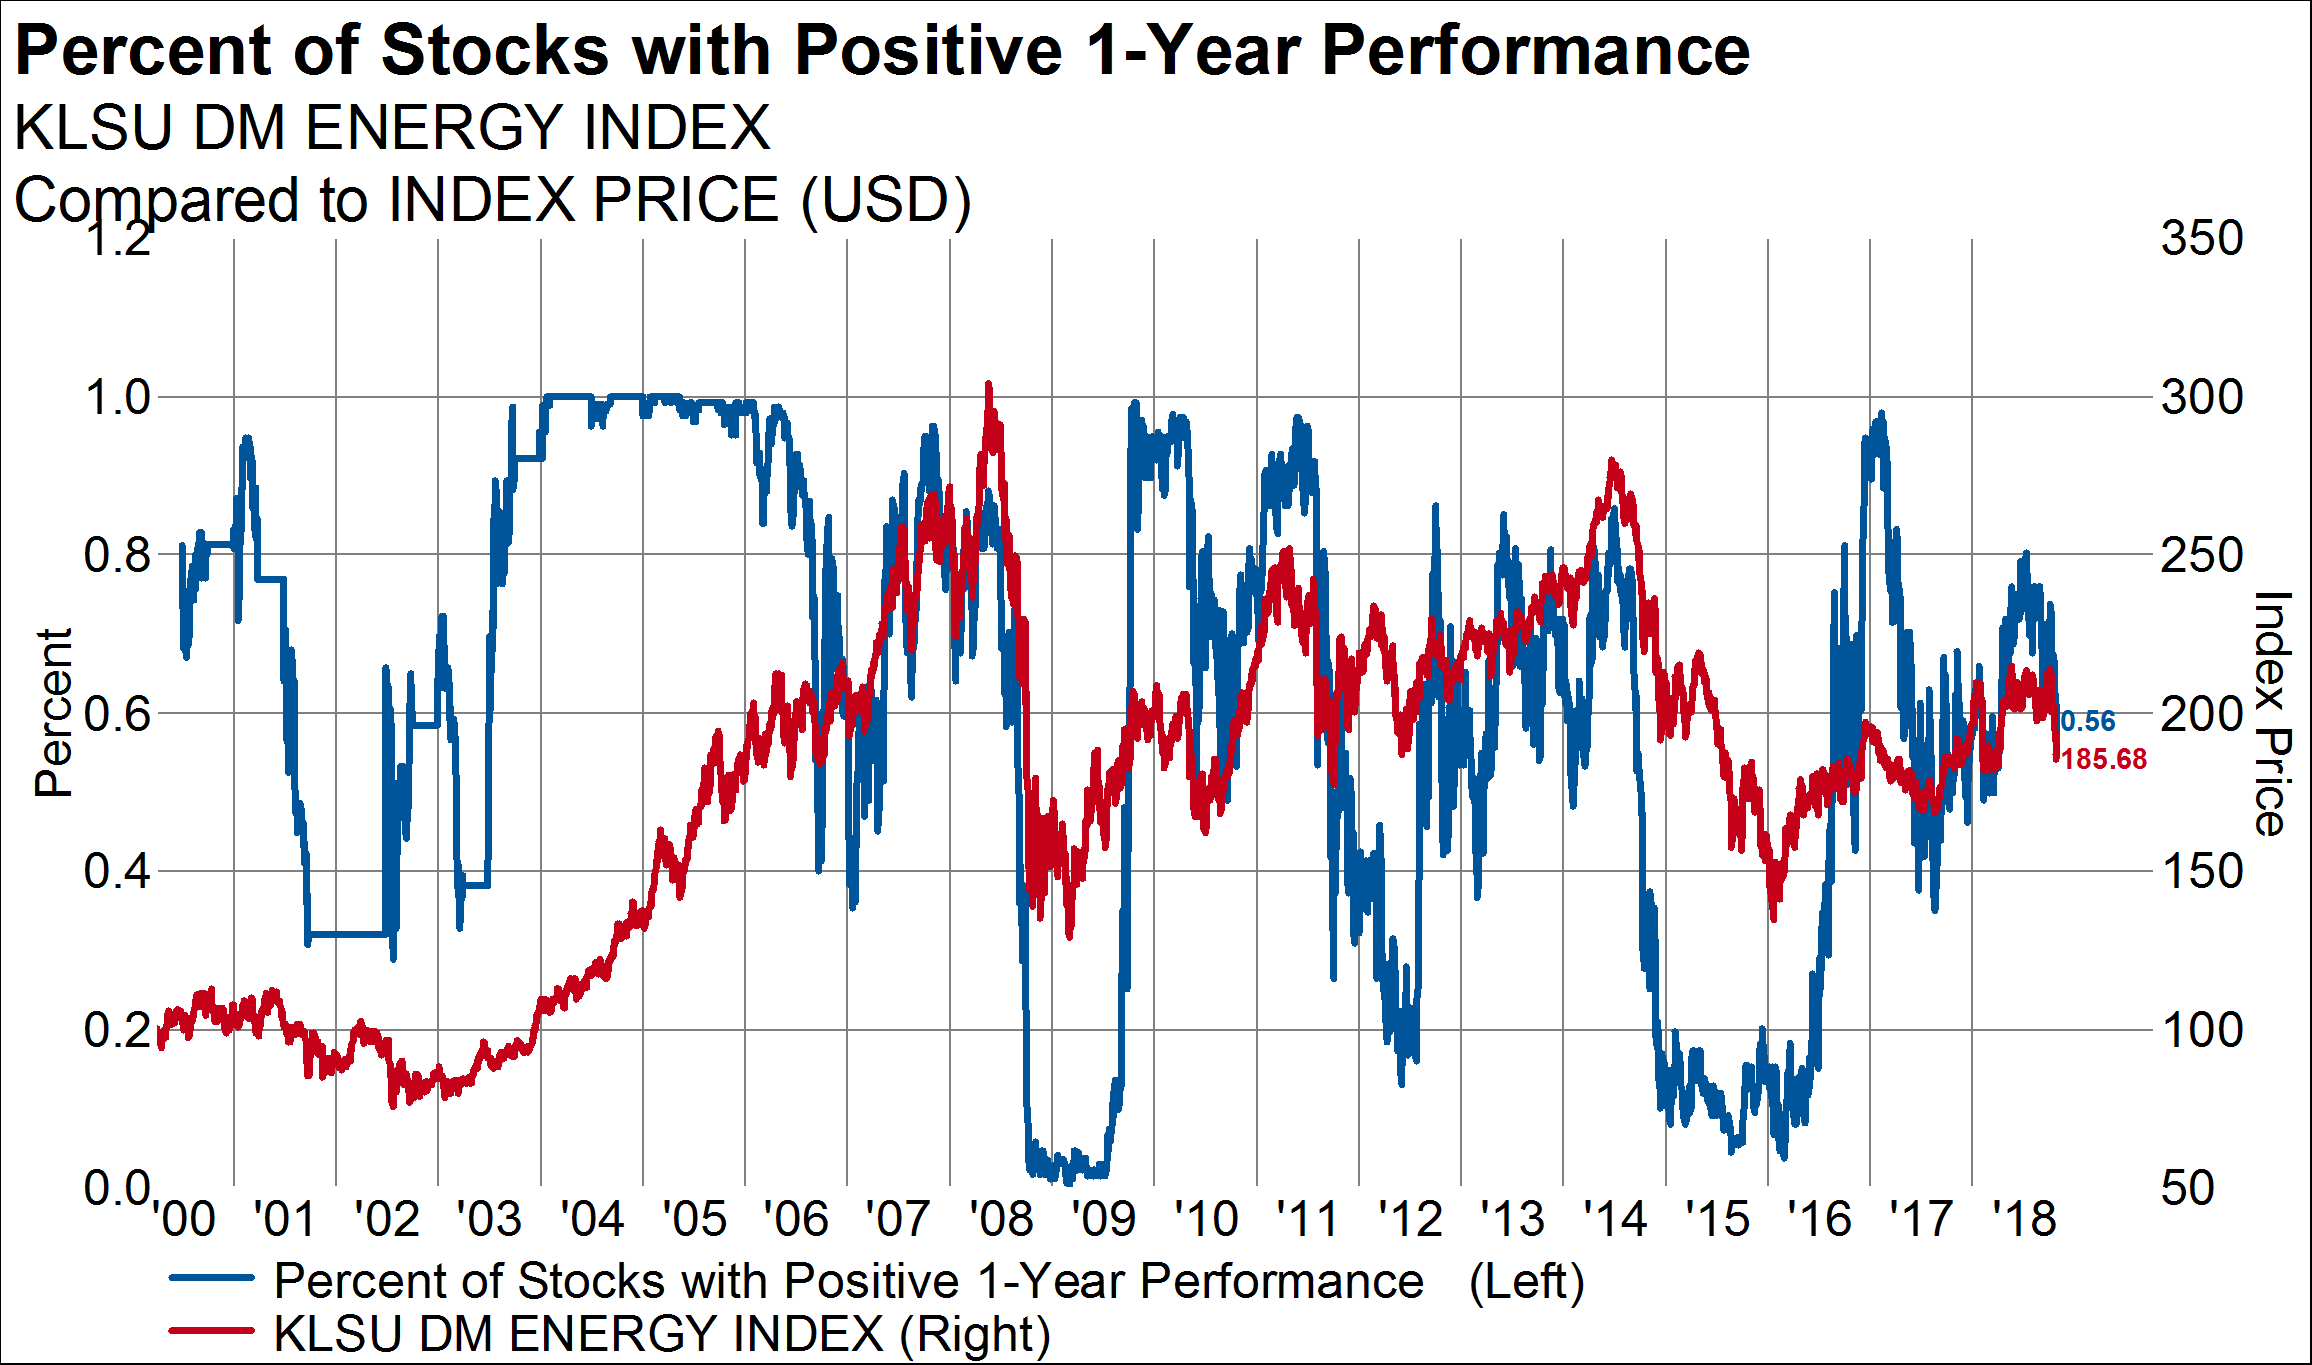
Fifty-six percent of energy companies (the 2nd most of any sector) are outperforming over the last year. Two years ago, less than 5% had positive 1-year performance.
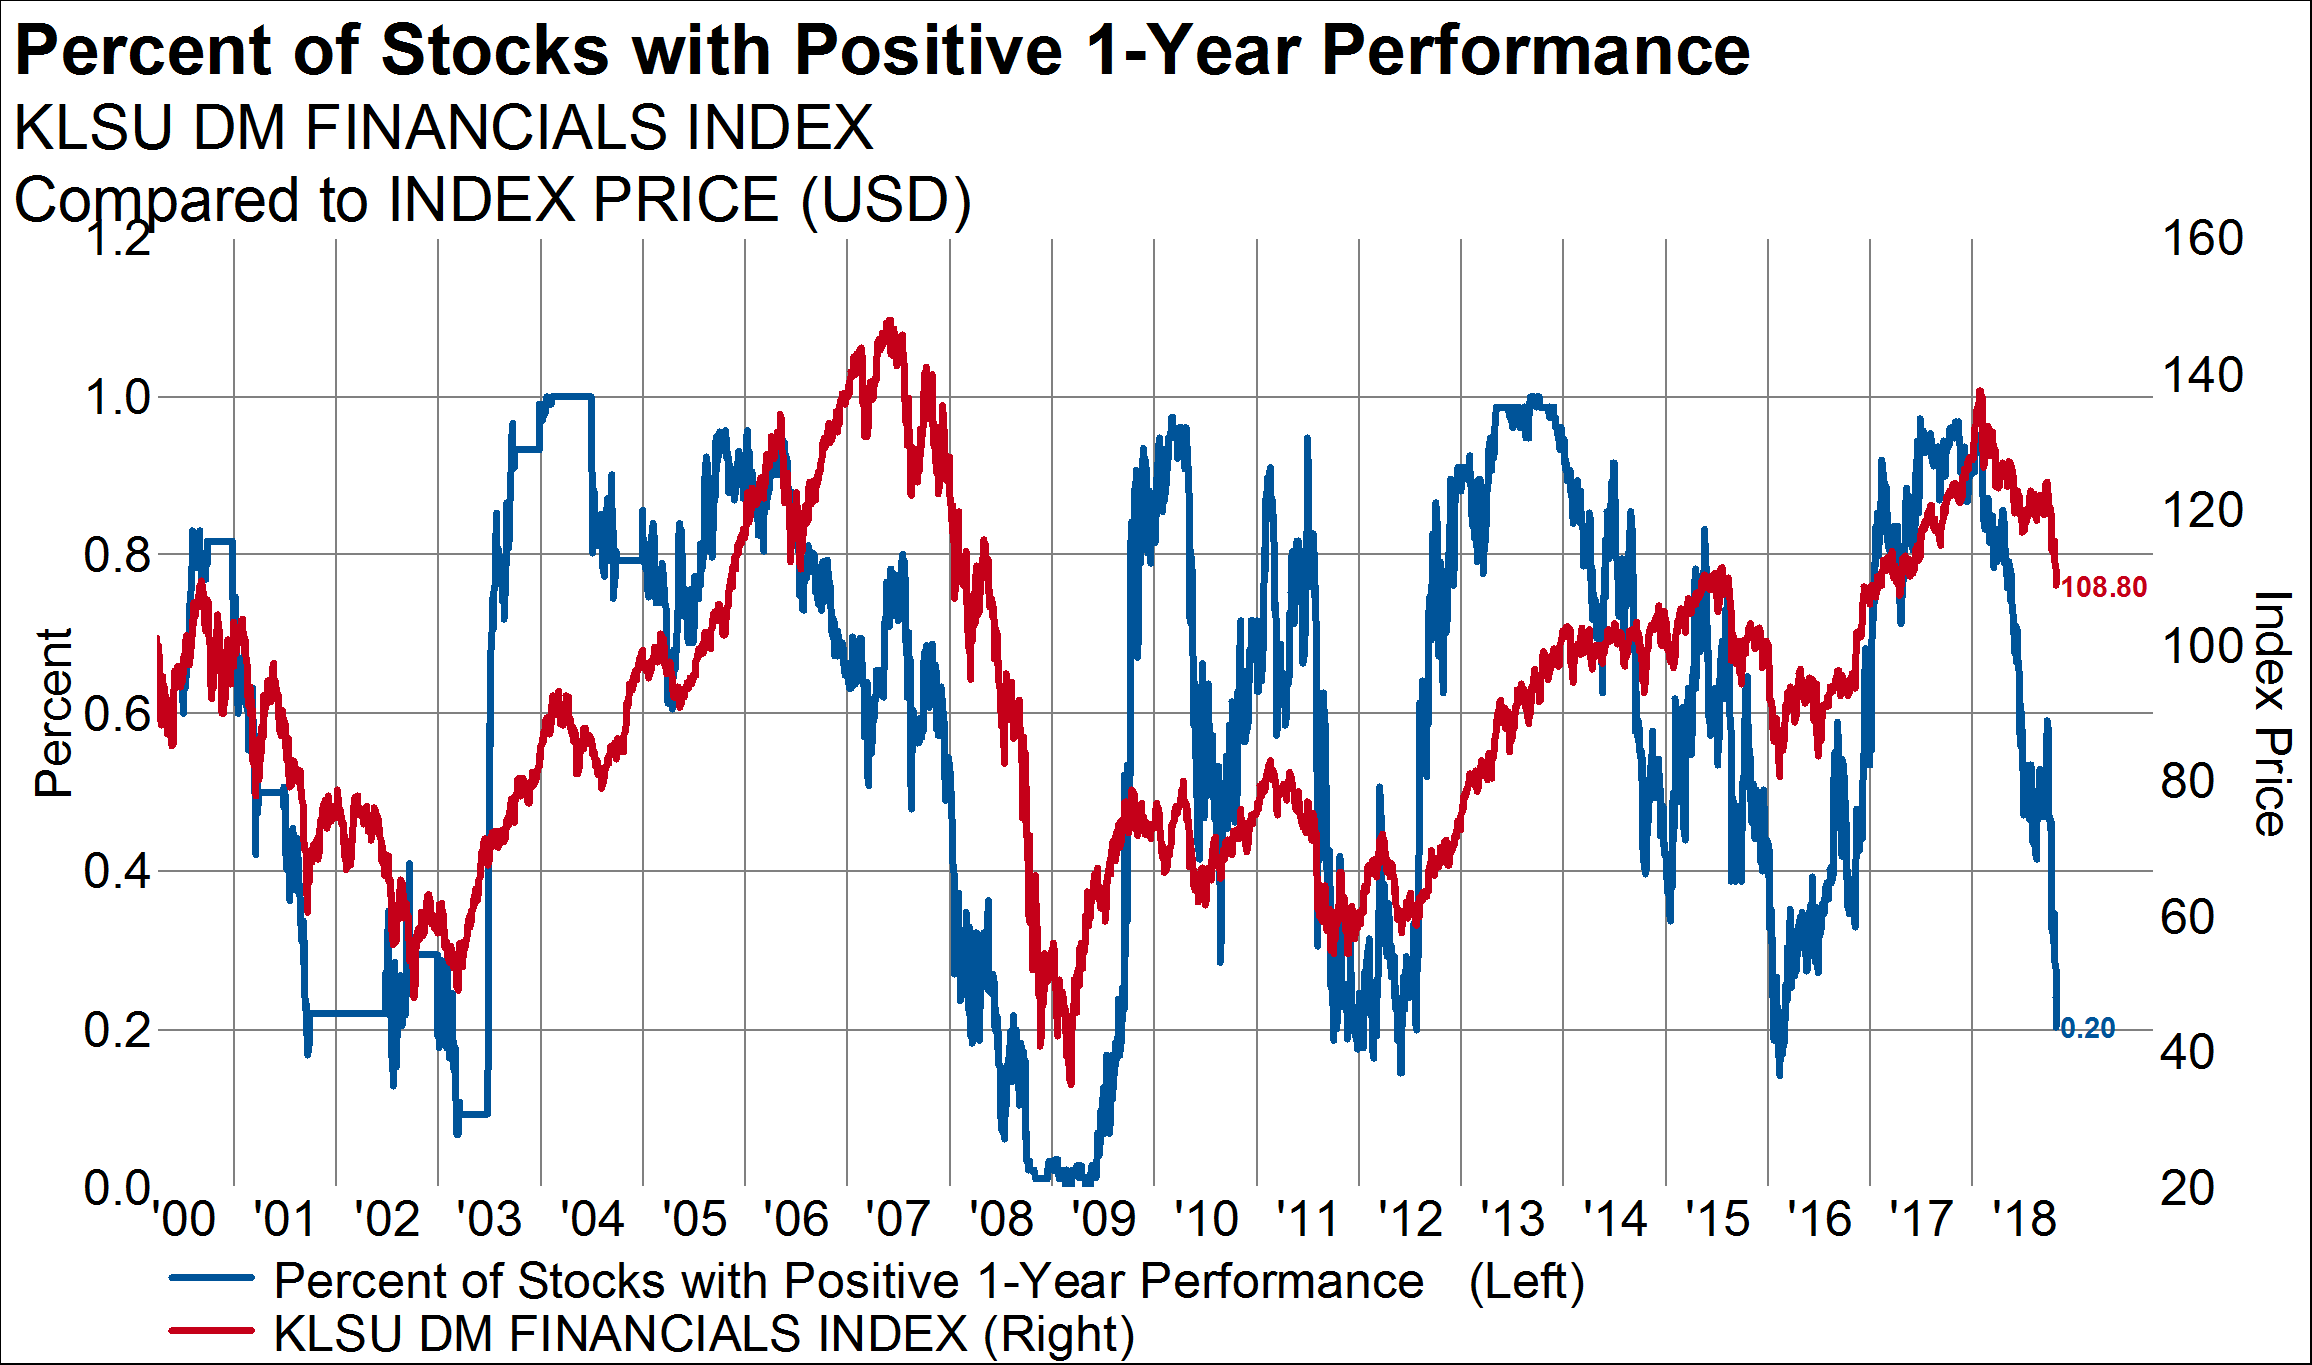
One of the hardest hit sectors globally is the financial sector, with only 20% of stocks with positive performance over the last year.
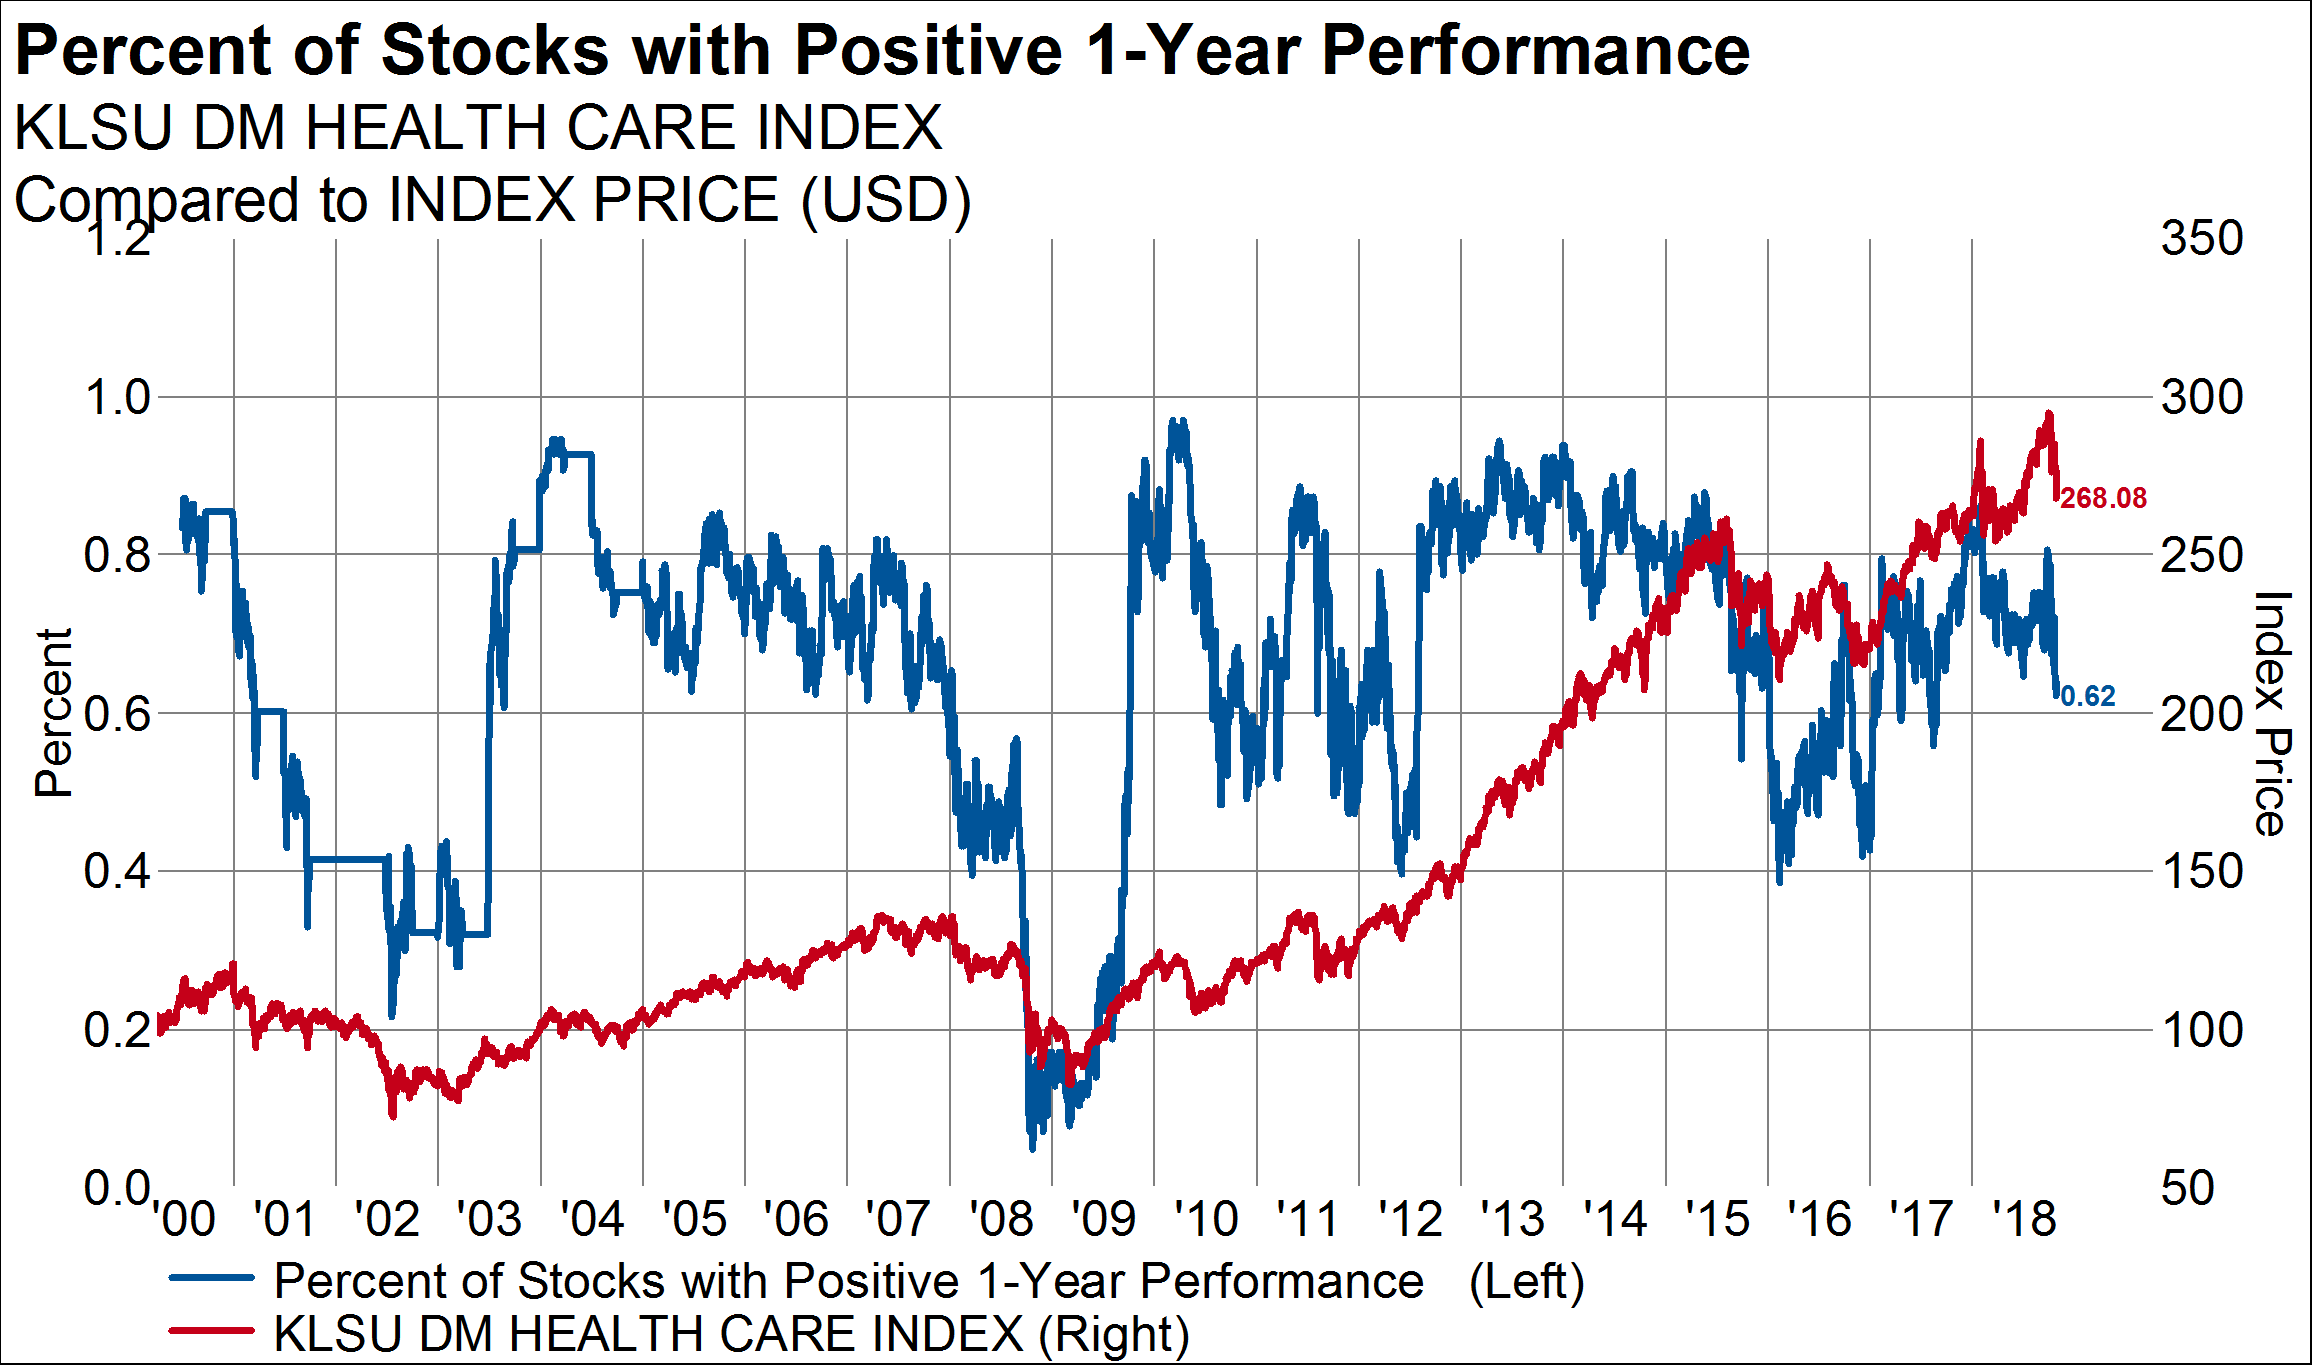
Health care had a higher percent of members with positive 1-year performance (62%).
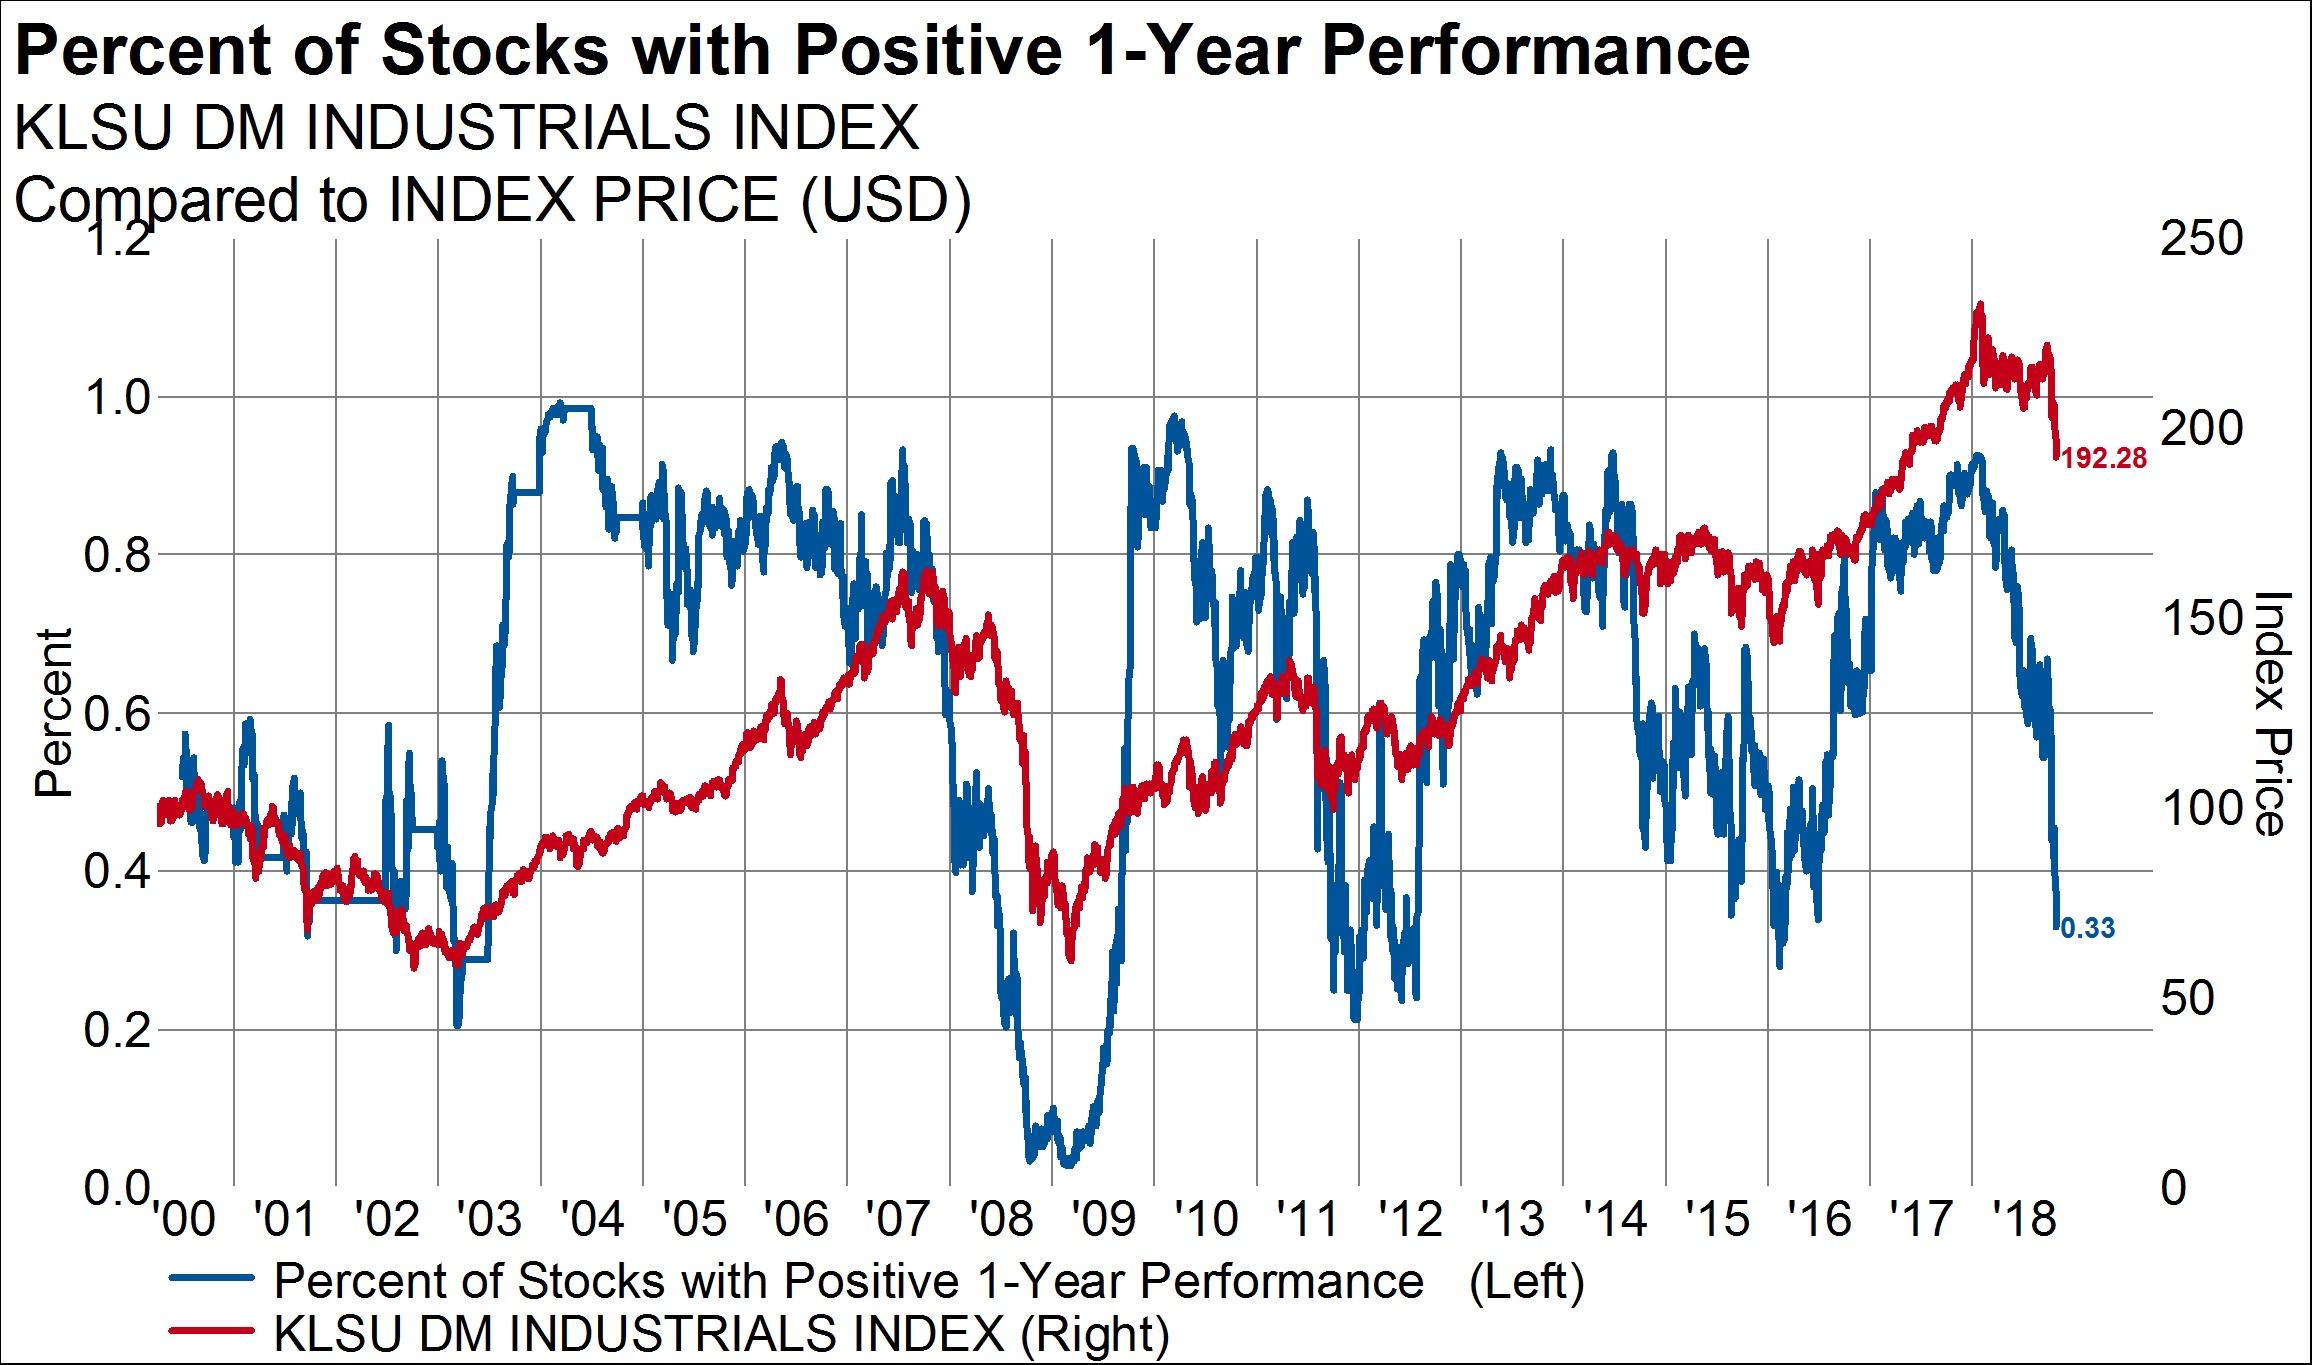
Thirty-three percent of global industrials had positive 1-year performance.
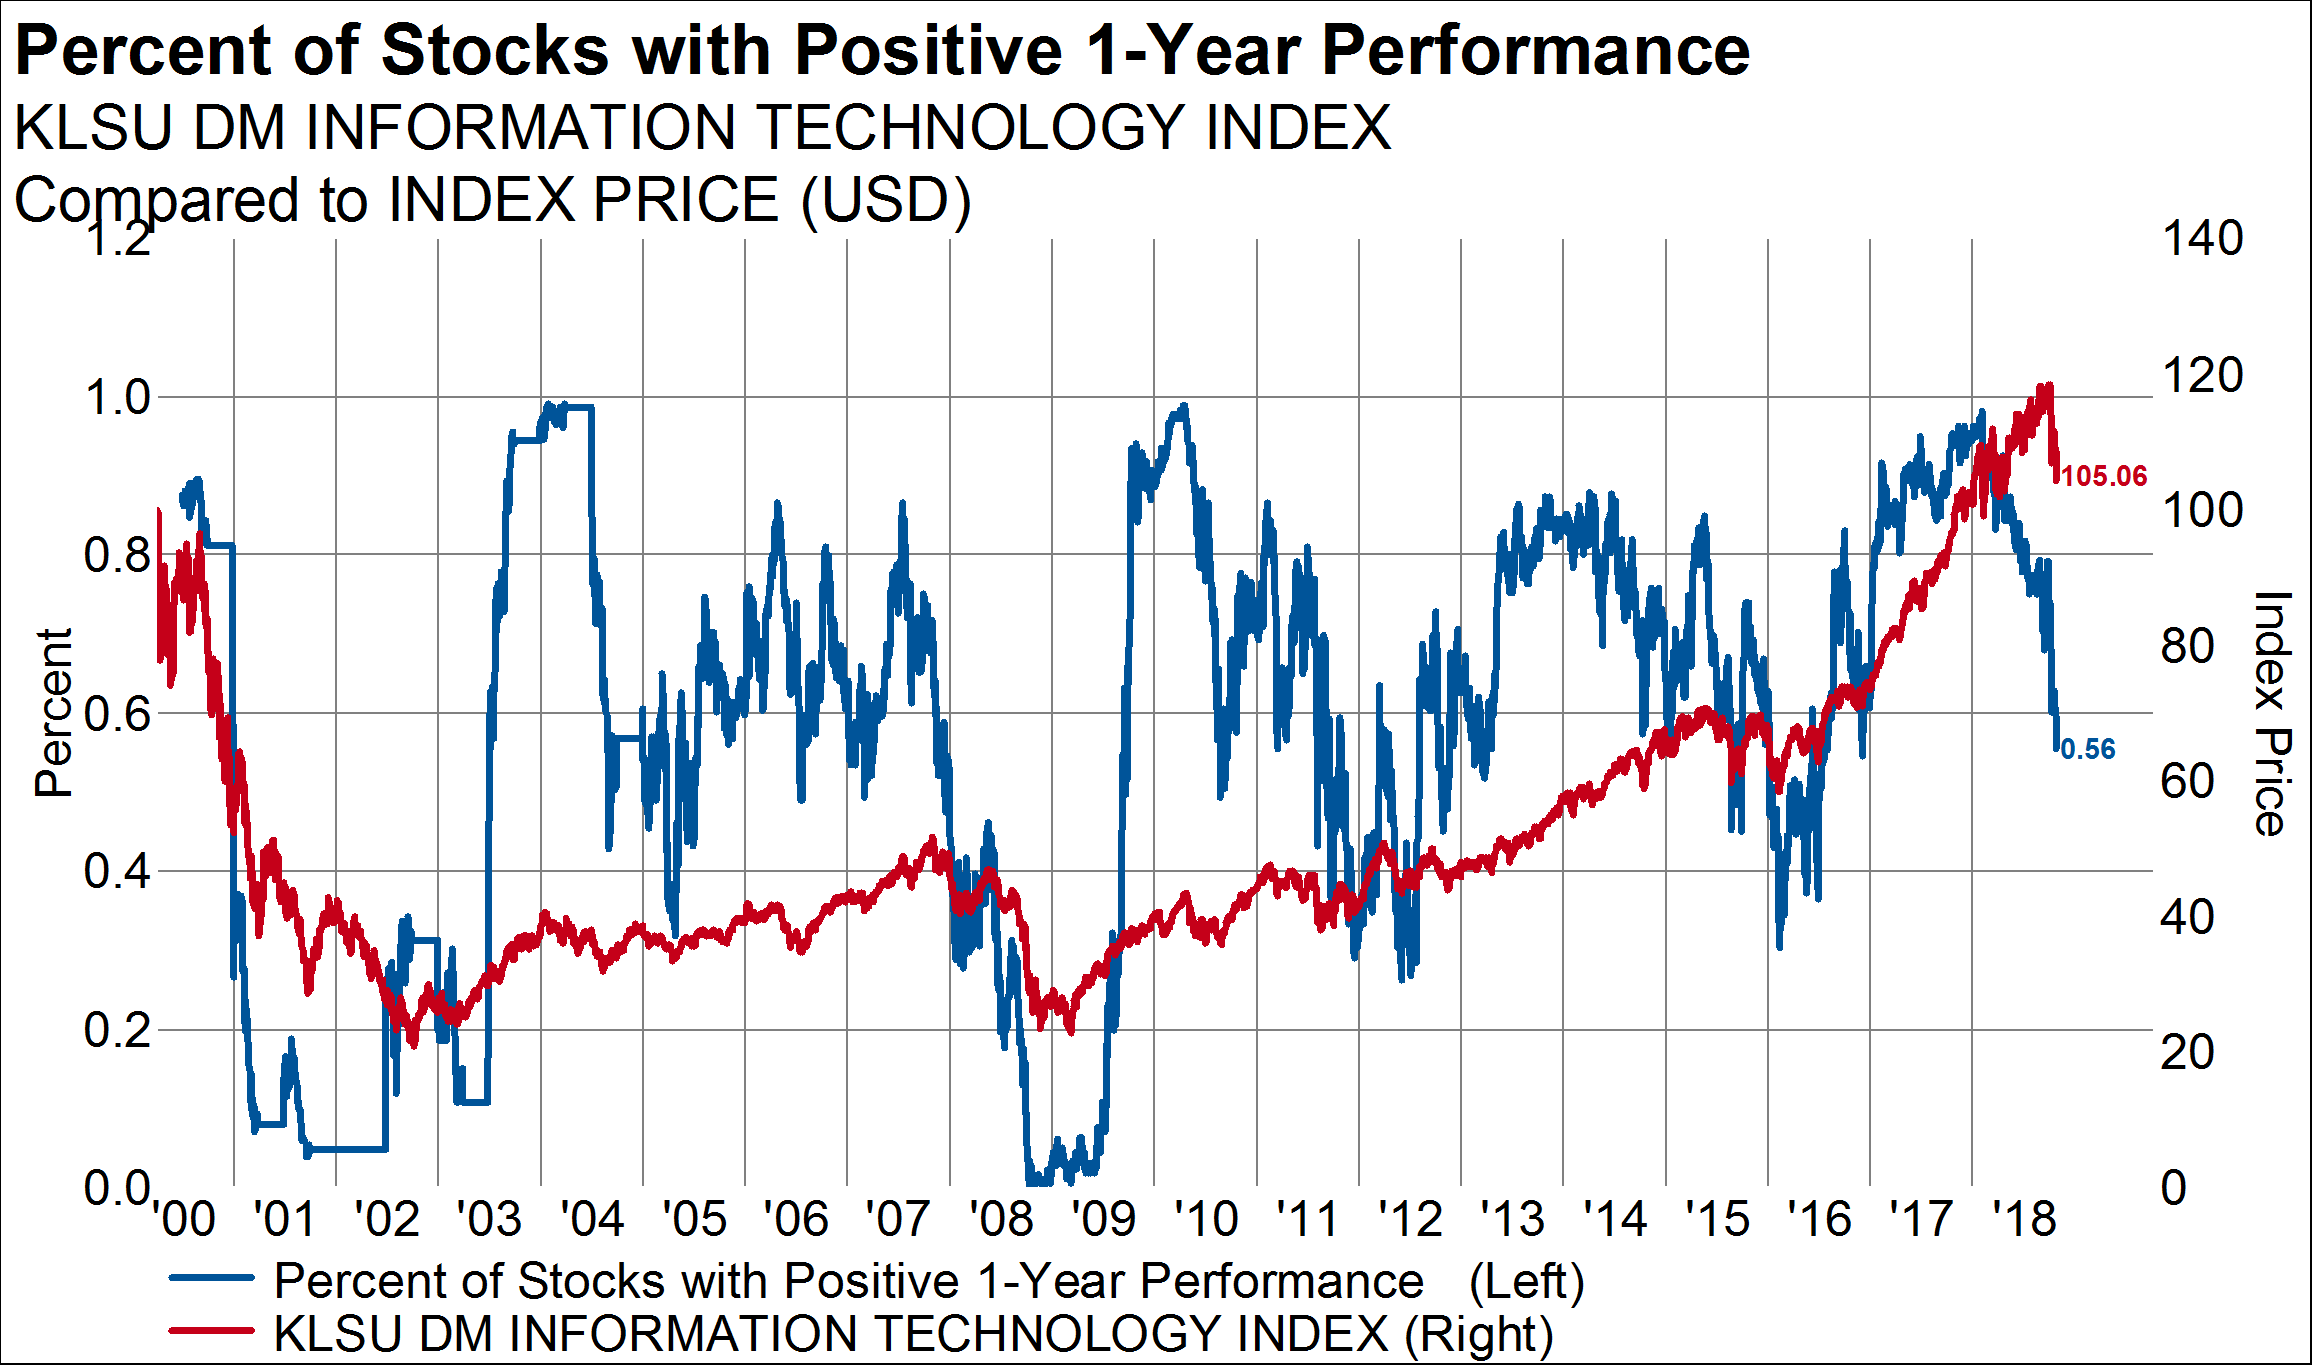
Fifty-six percent of tech had positive performance (tied for 2nd with energy), down from 98% earlier in the year.
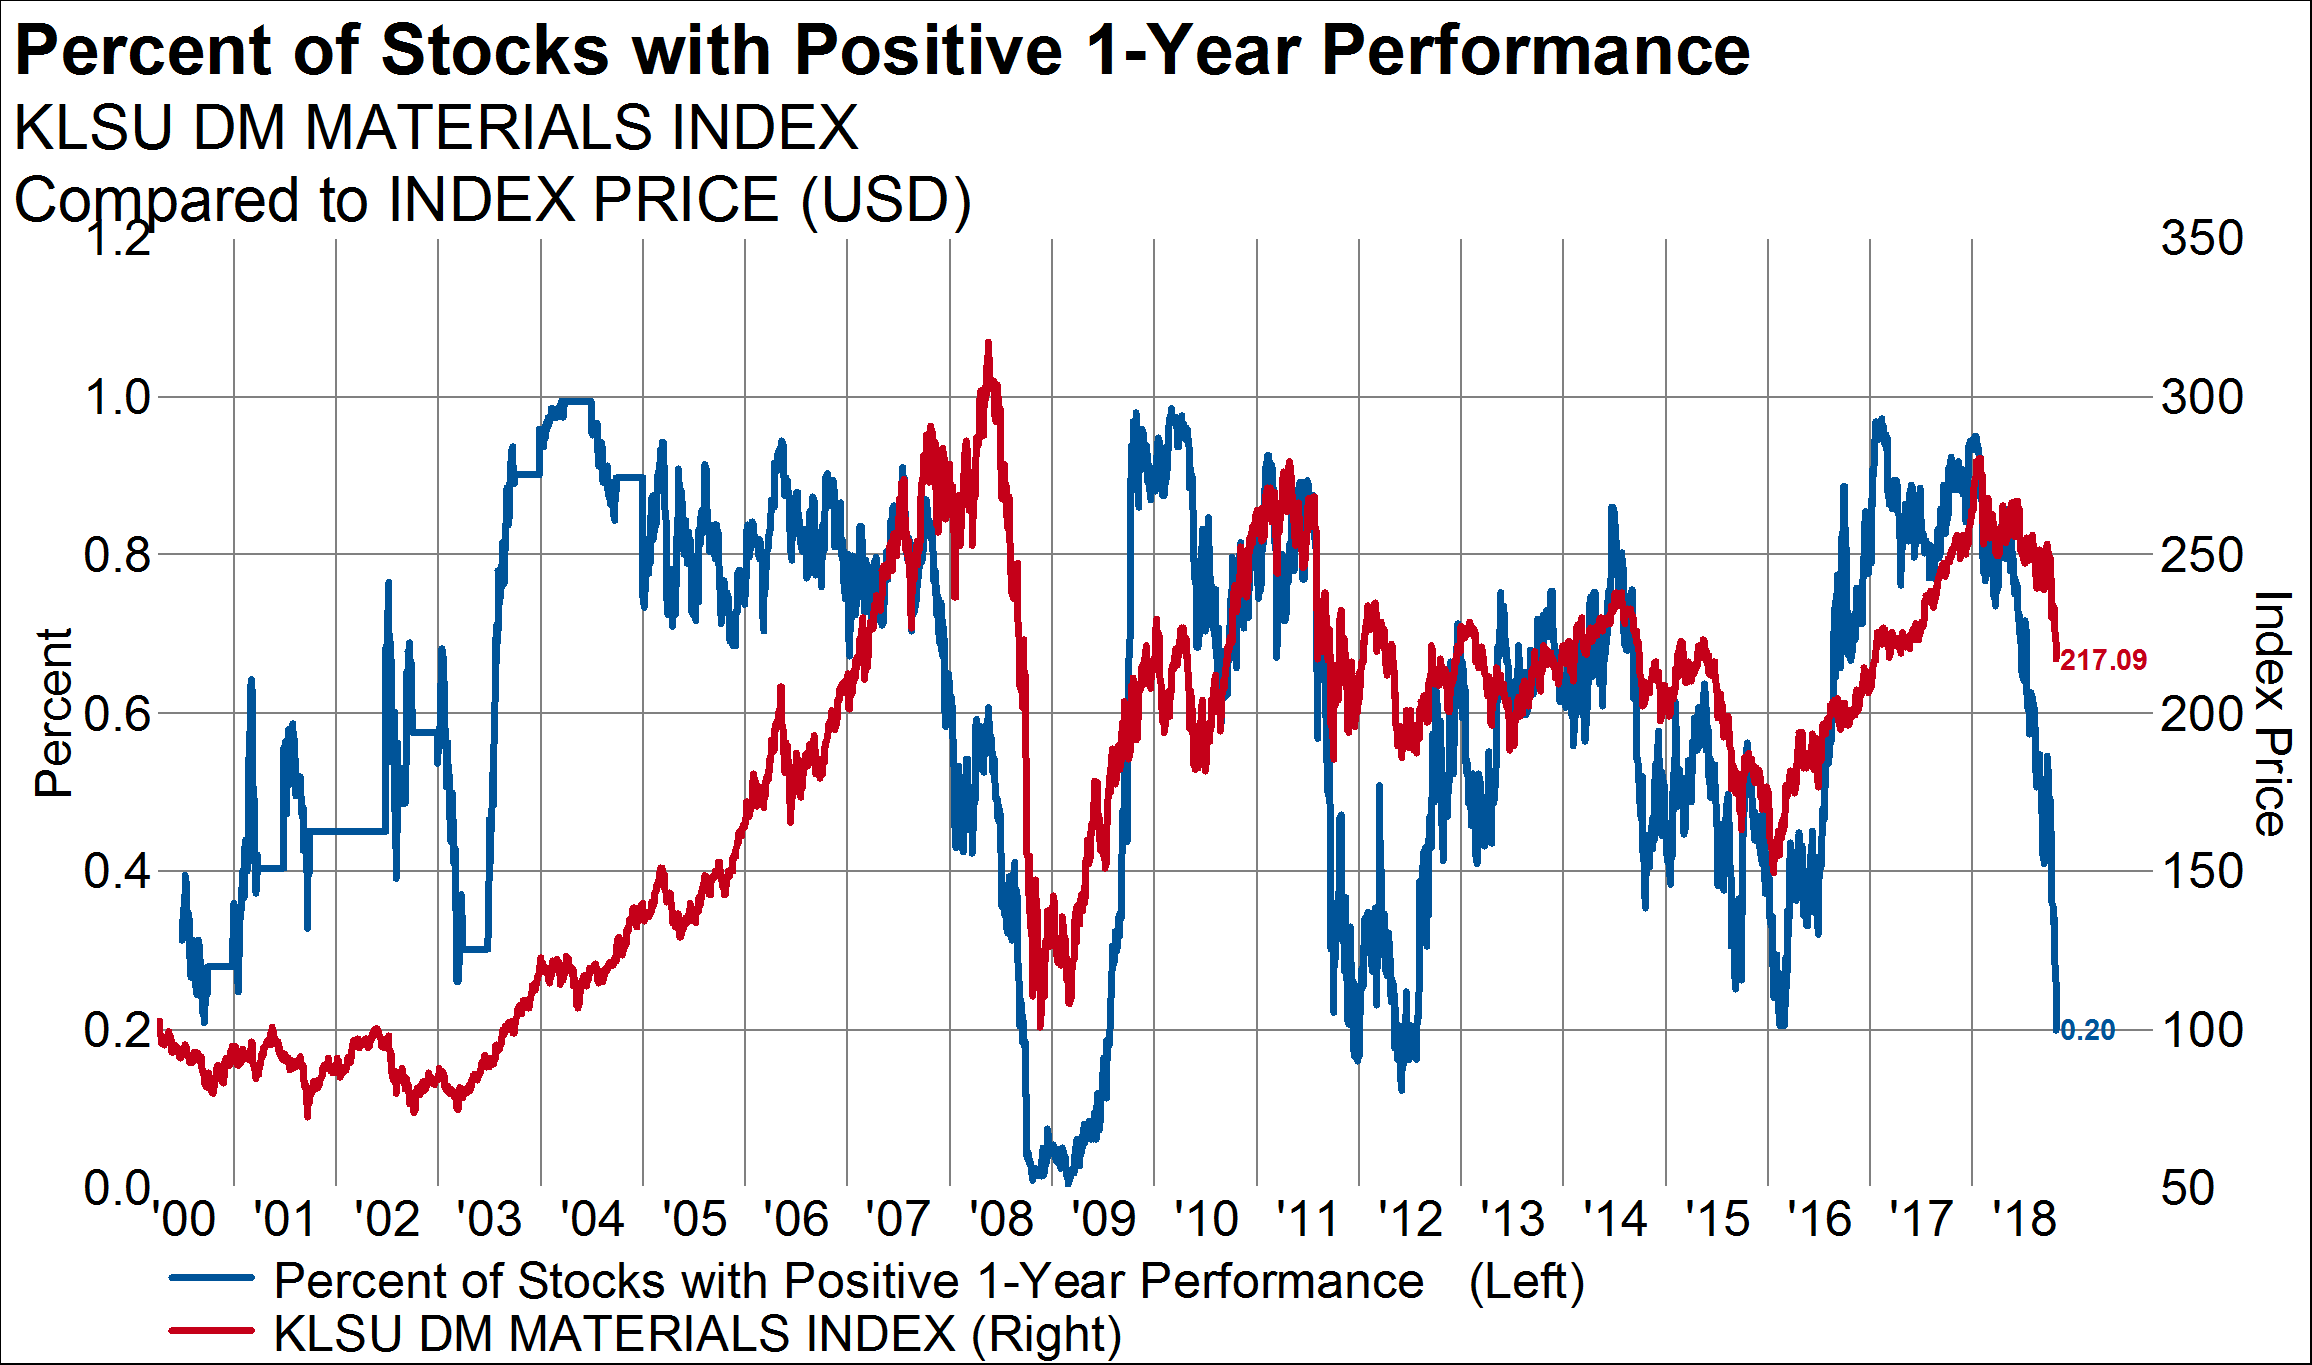
Similar to financials, 80% of materials companies had negative 1-year performance.
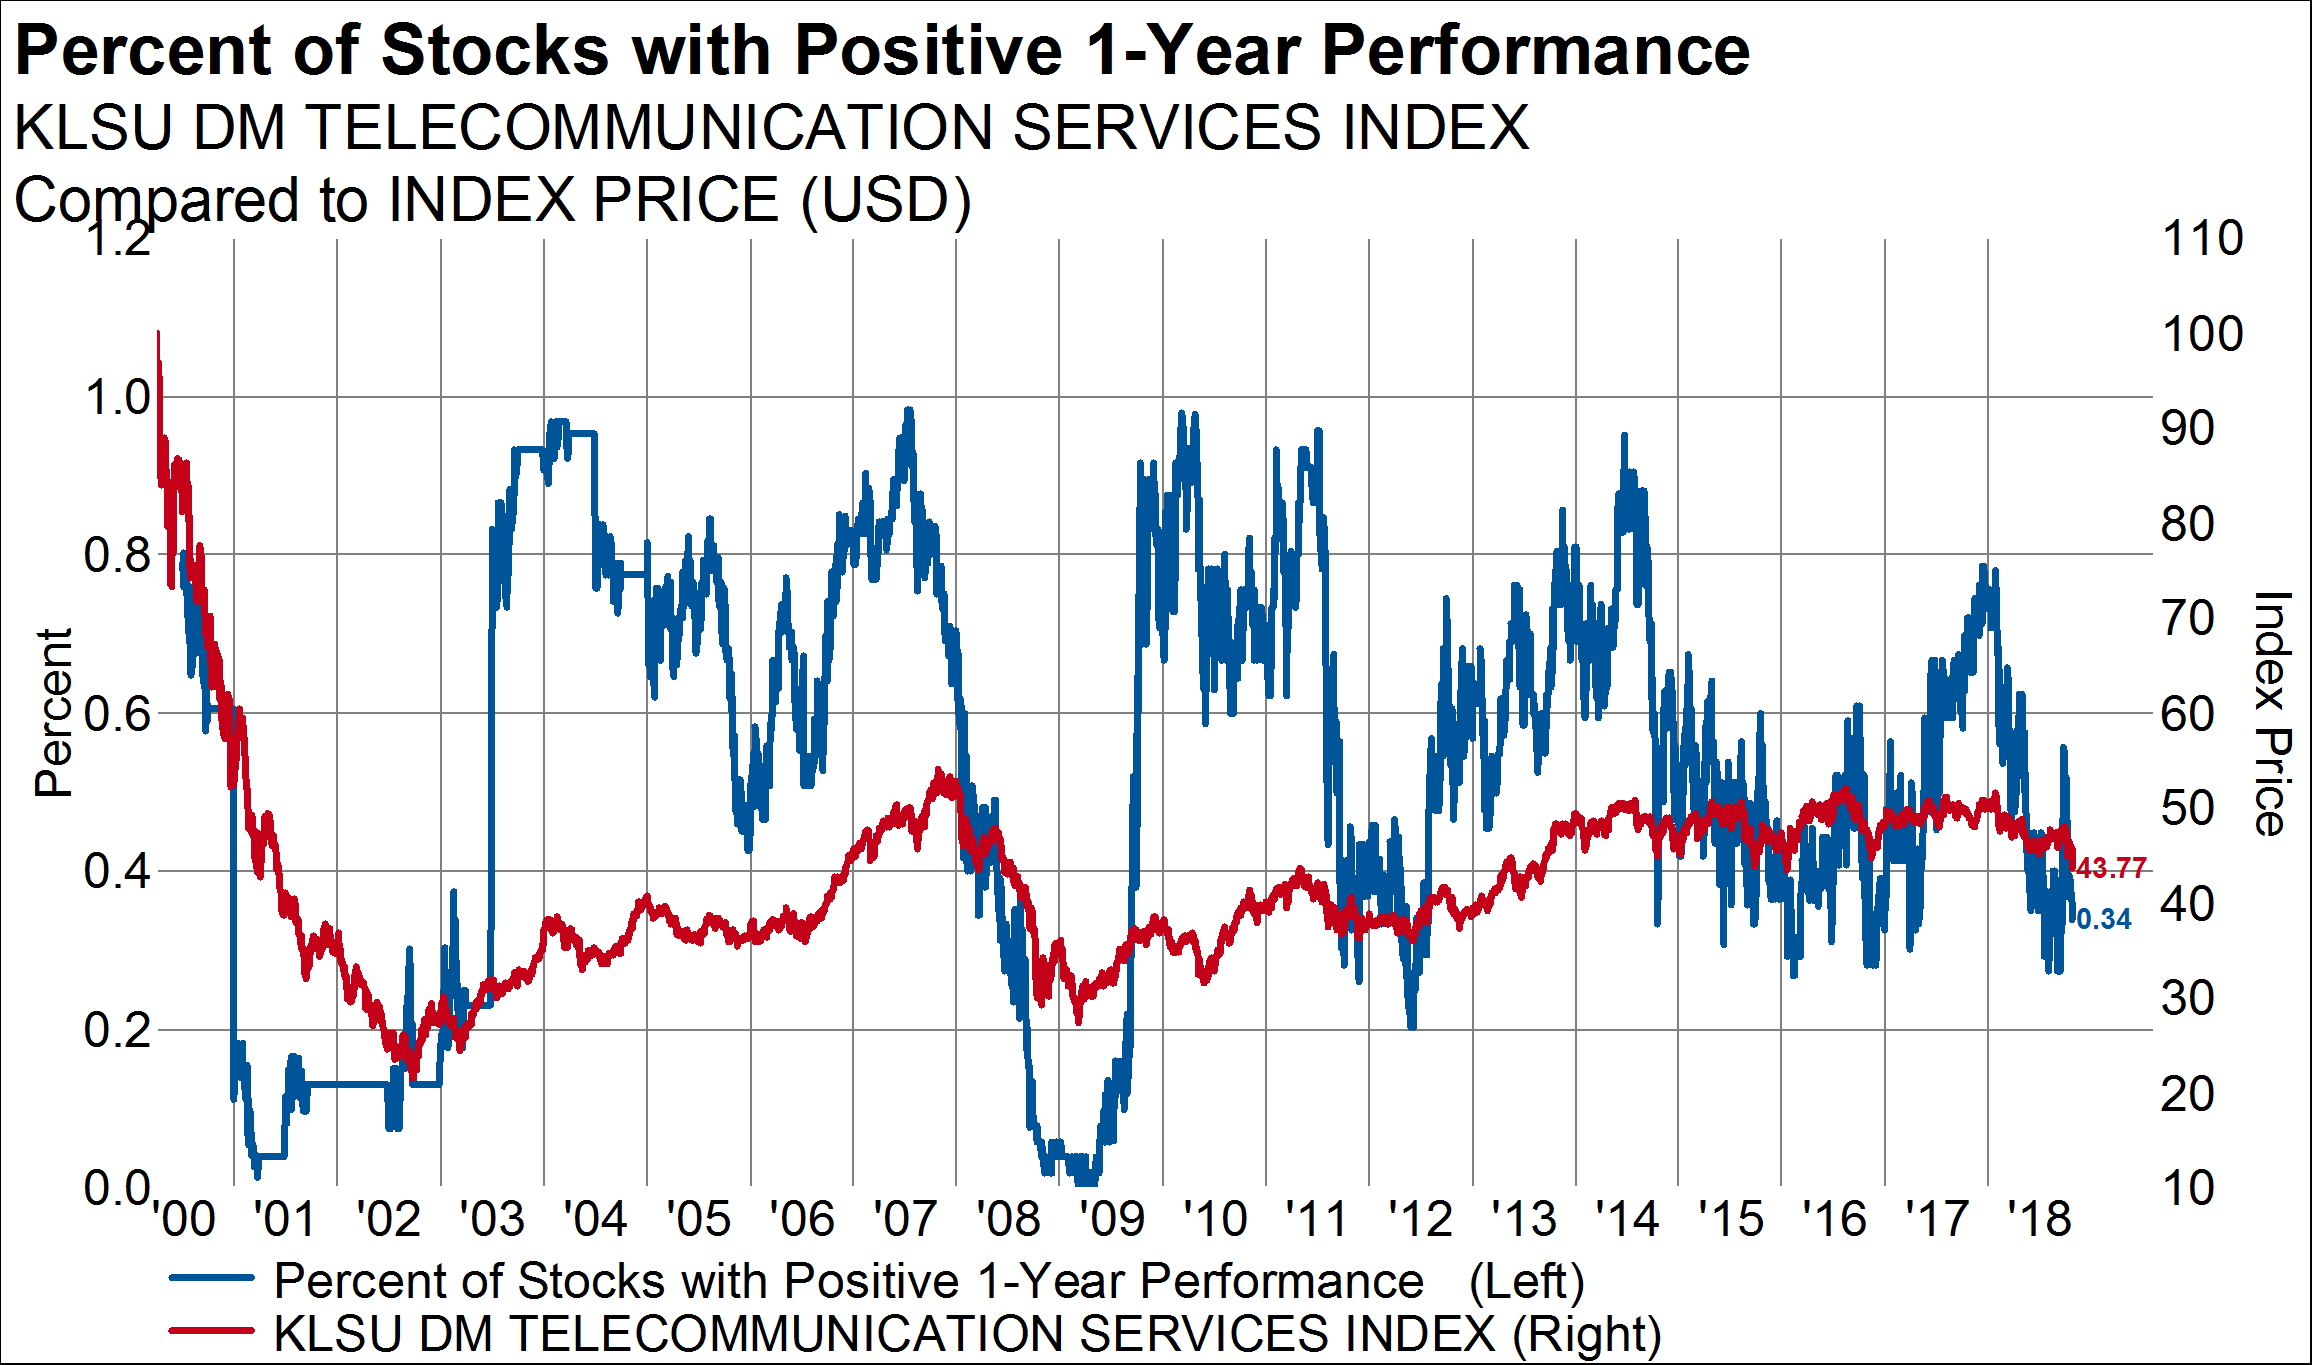
Thirty-four percent of telecommunications companies had positive 1-year performance.
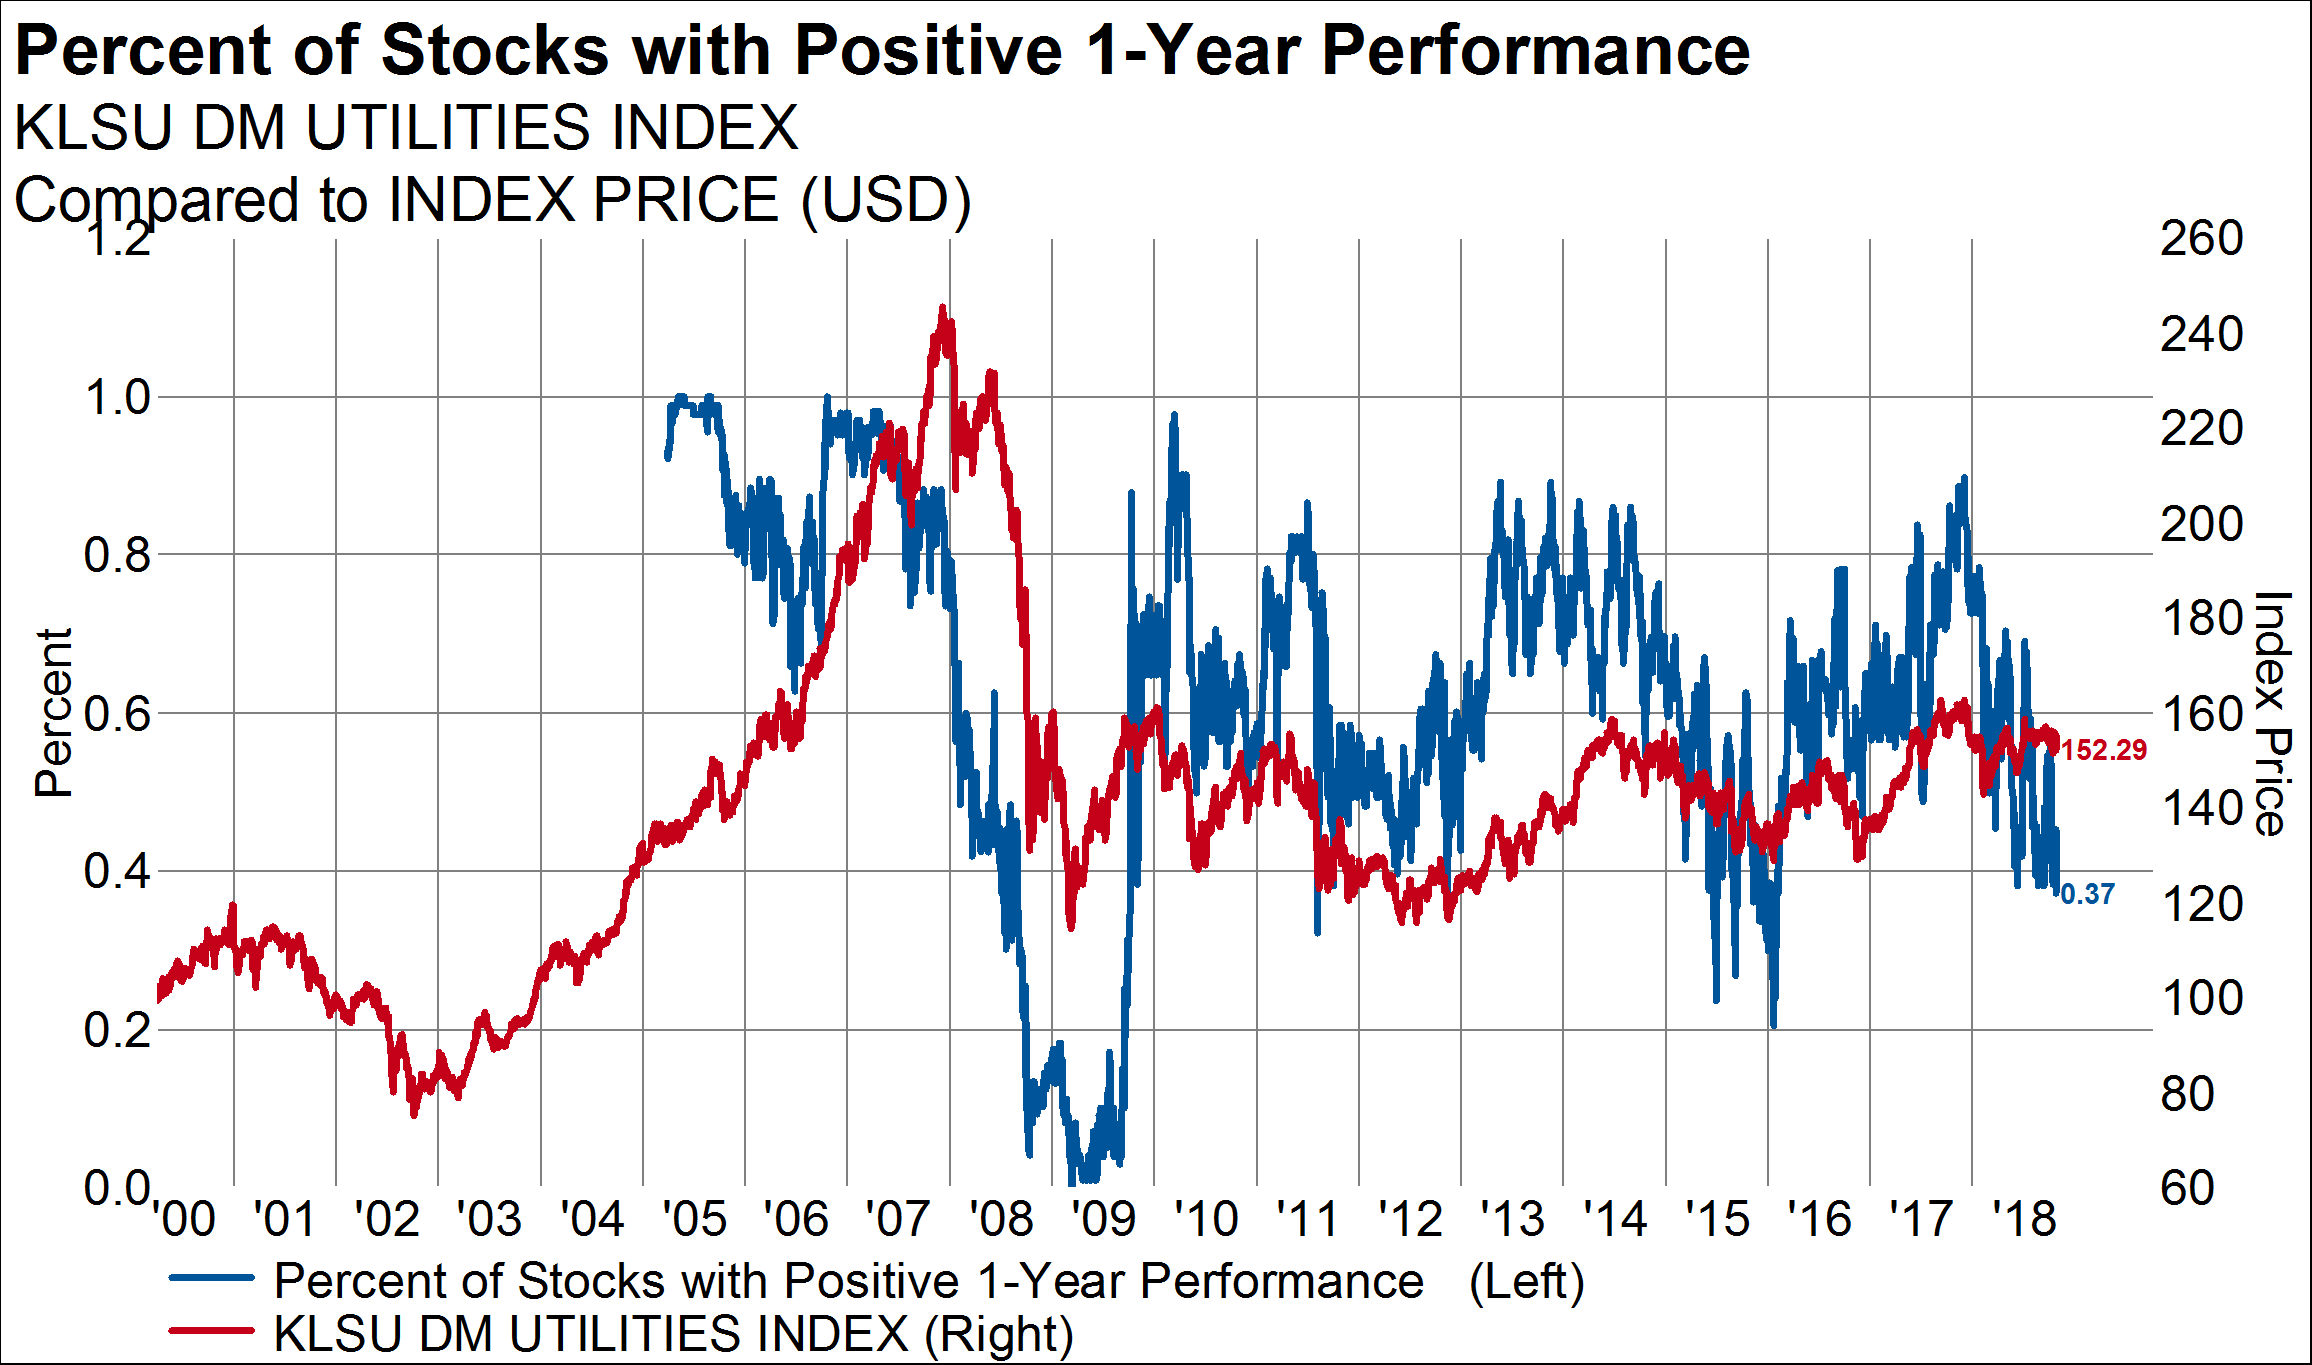
Thirty-seven percent of global utilities had positive 1-year performance.
It is a sloppy market out there, but our data suggests that energy is moving into a leadership position globally. This transition looks a lot like the transition that happened off the November 1998 low ($10 oil). Small-cap, resource-related, Emerging Markets, and interest-sensitive groups all began to work while tech/growth leadership faded. It is a good rule of thumb that a leadership group (FANGs) that tips over may experience a 40% initial decline (it’s down about 20-25% so far).
We could have a good bounce, and then potentially a second wave lower. Secular declines often have happened in three waves. 2002-03 is a great example with emotional lows in July and November 2002, and then an ultimate low in March 2003.
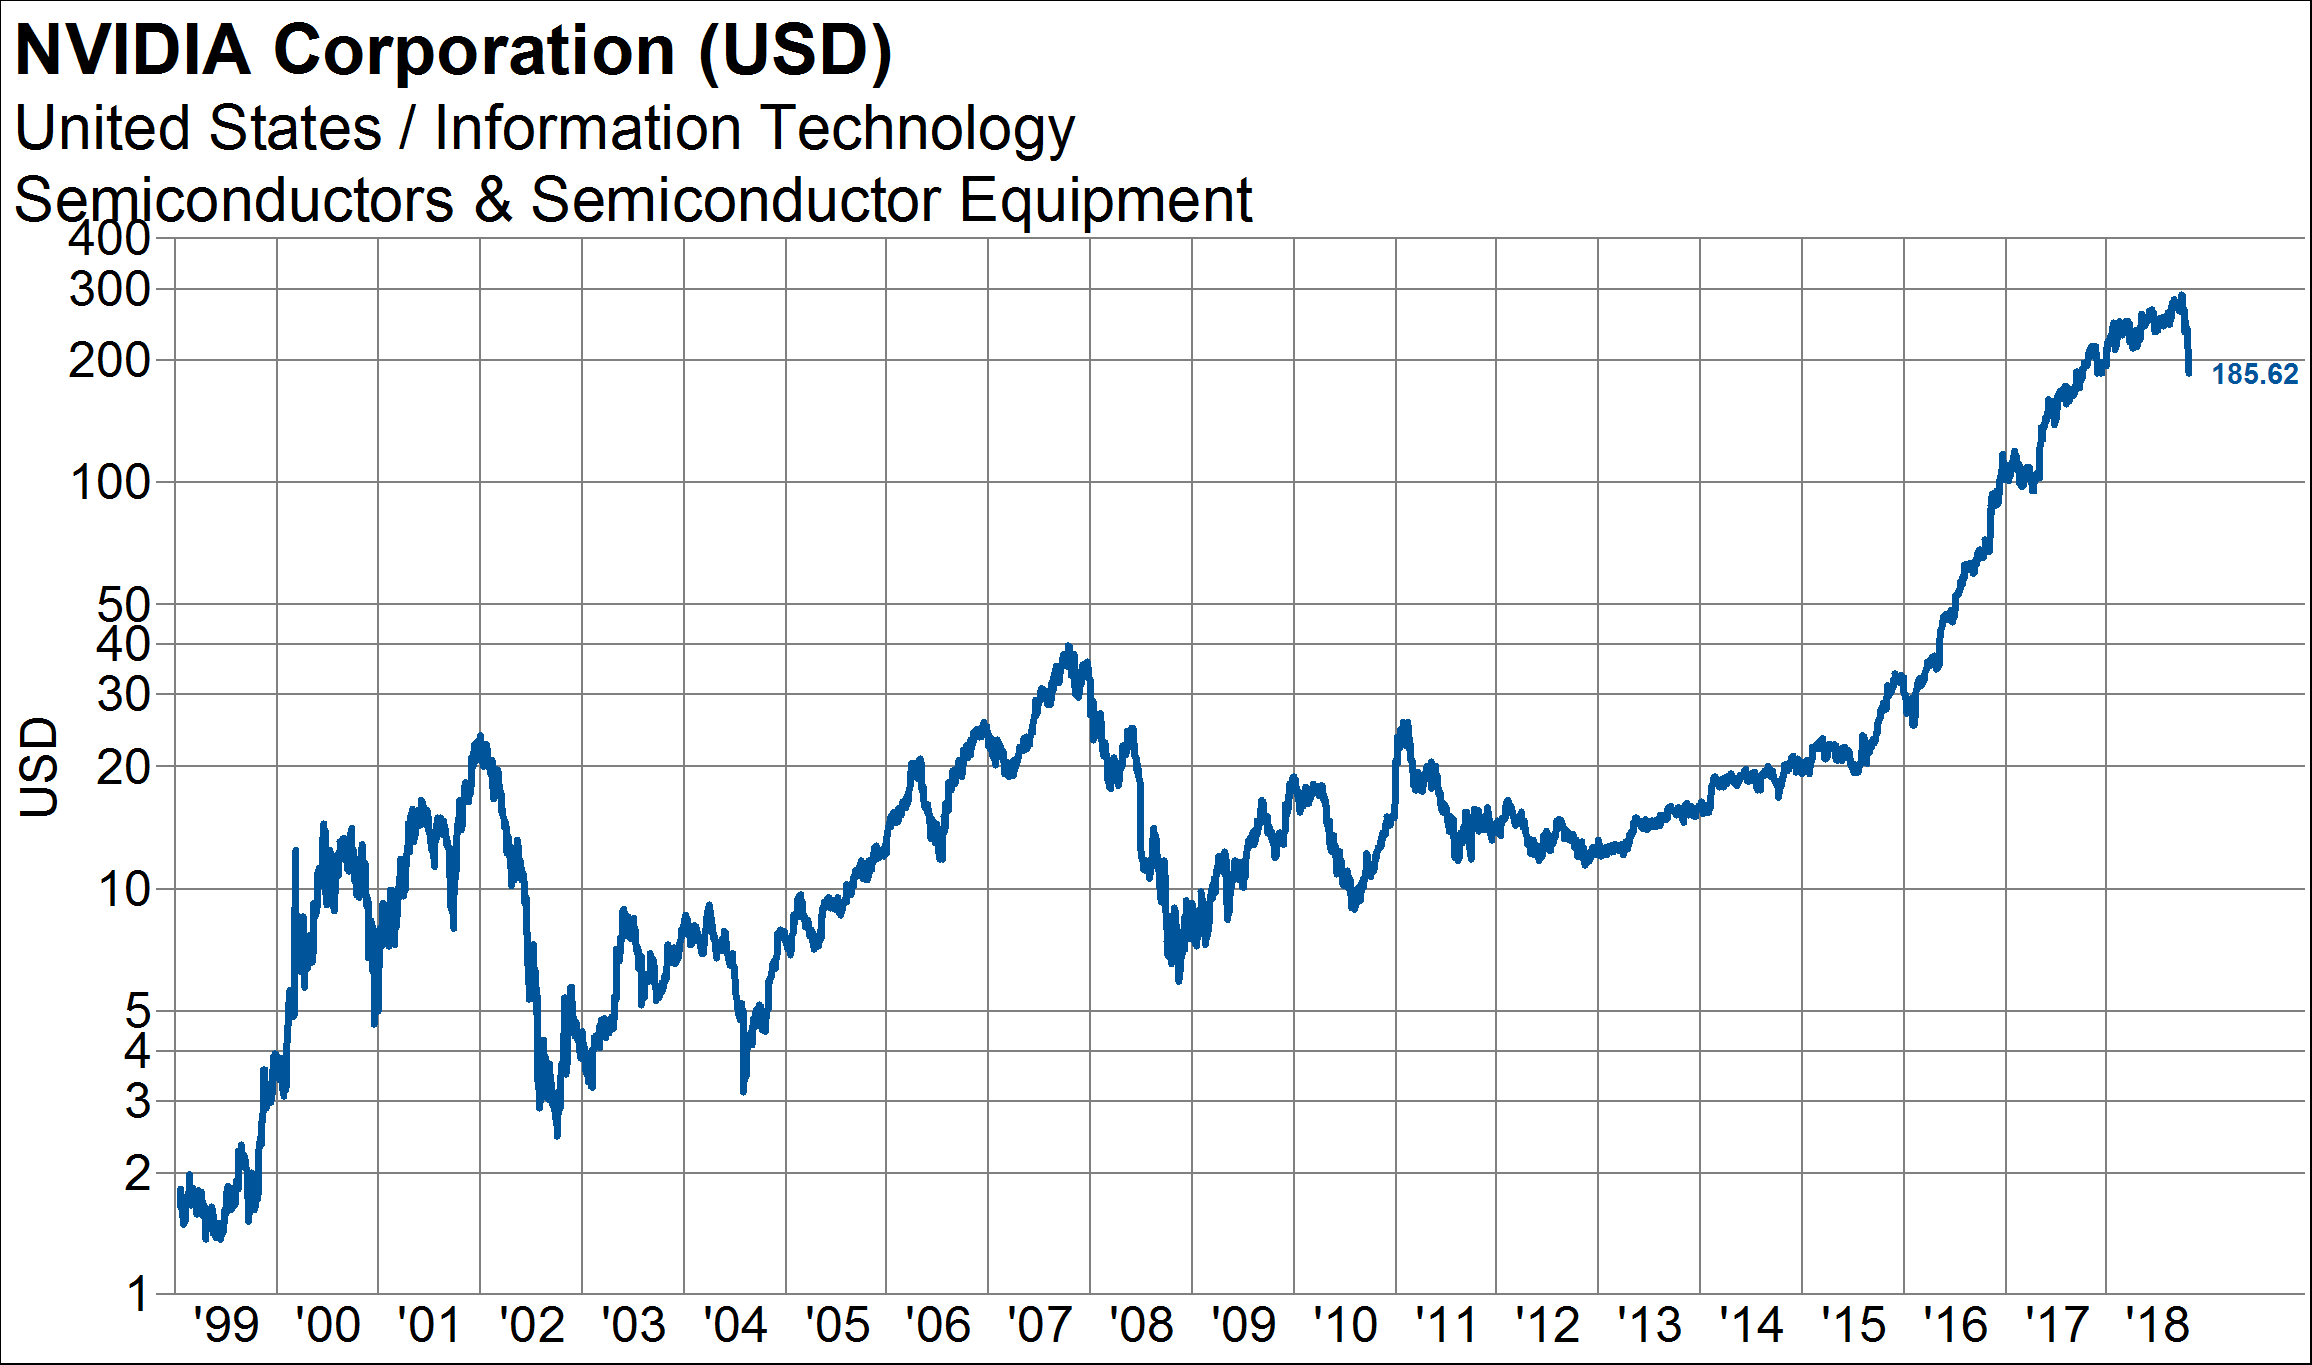
Real risk lies in technology names like NVIDIA. It could fall 90% and erase the 2016-to date move… and then some. It fell 90% in 2002 and 2008. The current decline was after a massive secular advance. From 2015, NVIDIA still is up 10x.
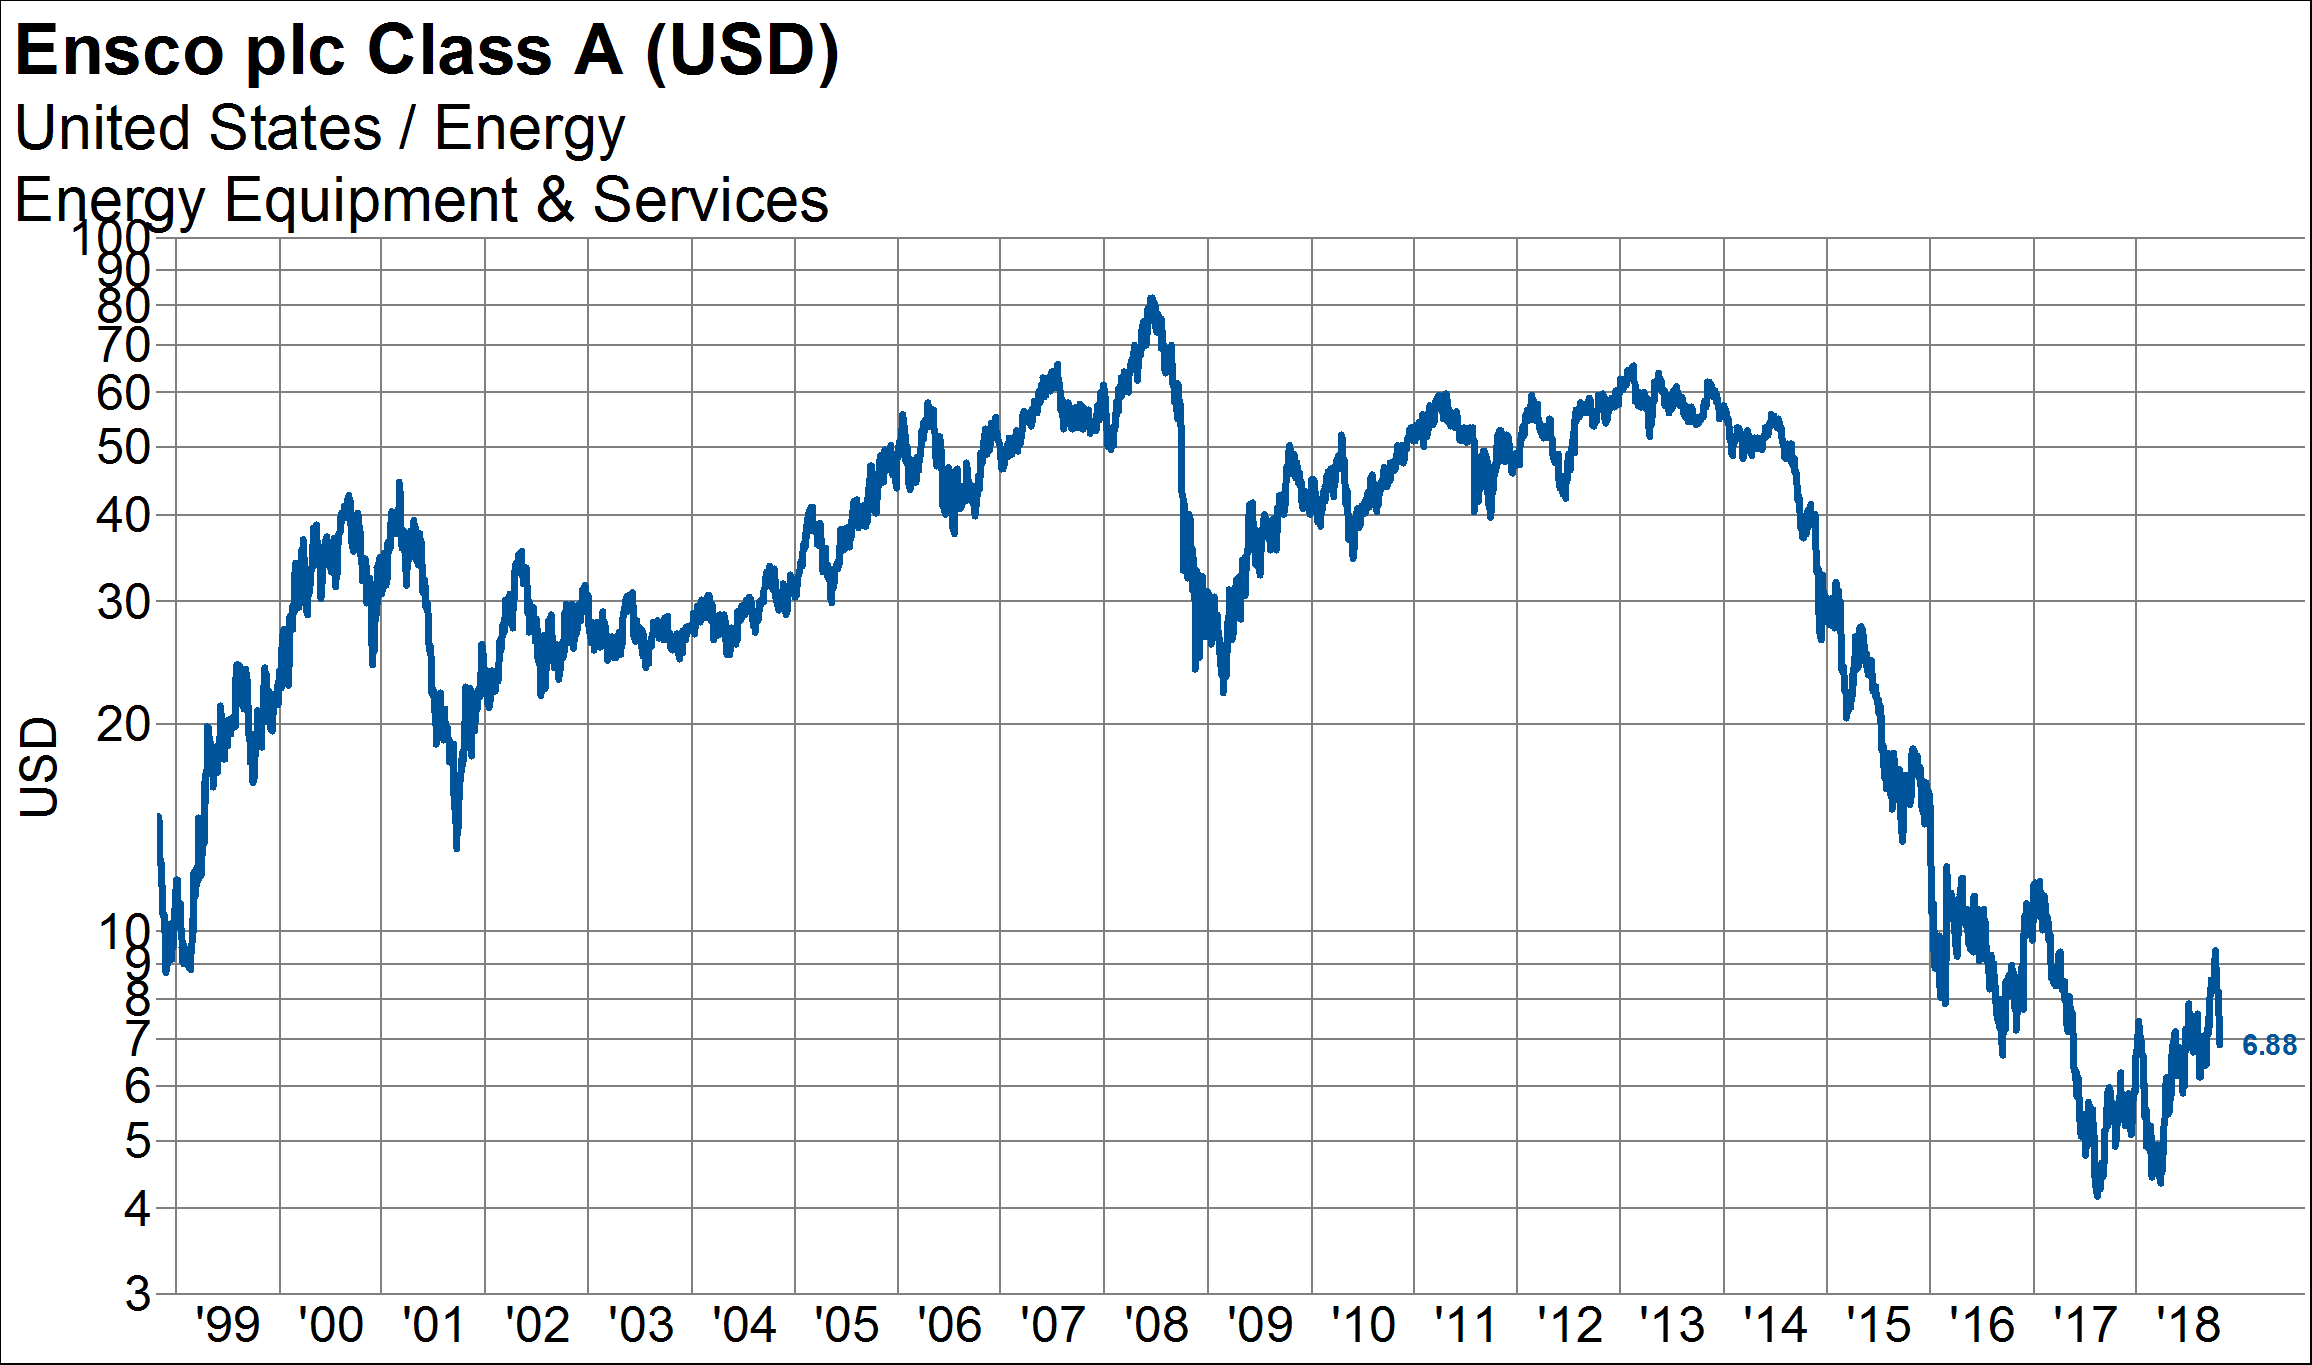
An energy company like Ensco could be on the opposite end of the risk spectrum. We already have experienced the 90% decline/bear market/bust cycle. This recent minor decline was after a massive secular decline. From 2015, Ensco is down 90%.
Diversification is predicated on the concept of mean reversion, which is why it hasn’t worked well lately. Few times in my career have I seen such extreme divergences that test the theory of mean reversion (technology in 1990s, Emerging Markets/resources/financials in 2000s), but historically, it always ultimately has played out for investors with a long-term time horizon.
As of 9/30/18, Ensco and NVIDIA were owned in different Knowledge Leaders Strategies.
